Page 405 - Essencials of Sociology
P. 405

378    CHAPTER 12               Marriage and Family

                                       Childbirth

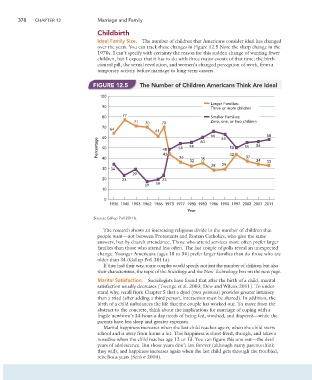
                                       Ideal Family Size.  The number of children that Americans consider ideal has changed
                                       over the years. You can track these changes in Figure 12.5 Note the sharp change in the
                                       1970s. I can’t specify with certainty the reason for this sudden change of wanting fewer
                                       children, but I expect that it has to do with three major events of that time: the birth
                                       control pill, the sexual revolution, and women’s changed perception of work, from a
                                       temporary activity before marriage to long-term careers.


                                      FIGURE 12.5        The Number of Children Americans Think Are Ideal

                                        100
                                                                                      Larger Families:
                                         90                                           Three or more children
                                         80       77                                  Smaller Families:
                                                      71   70     70                  Zero, one, or two children
                                         70
                                            64
                                                               61
                                                                                      66  63                58
                                         60
                                       Percentage  50             48    54   55  60          42    55   56
                                                                                             50
                                                                  43
                                                                         36
                                         40
                                                                             32  35                 37  34  33
                                                                                      28  29
                                         30  34
                                                      29
                                         20      23               23
                                                               19
                                                           17
                                         10
                                          0
                                            1936 1945 1953 1962 1966 1973 1977 1980 1983 1986 1990 1997  2003  2007  2011
                                                                            Year
                                      Source: Gallup Poll 2011b.

                                          The research shows an interesting religious divide in the number of children that
                                       people want—not between Protestants and Roman Catholics, who give the same
                                       answers, but by church attendance. Those who attend services more often prefer larger
                                       families than those who attend less often. The last couple of polls reveal an unexpected
                                       change: Younger Americans (ages 18 to 34) prefer larger families than do those who are
                                       older than 34 (Gallup Poll 2011a).
                                          If they had their way, some couples would specify not just the number of children but also
                                       their characteristics, the topic of the Sociology and the New Technology box on the next page.
                                       Marital Satisfaction.  Sociologists have found that after the birth of a child, marital
                                       satisfaction usually decreases (Twenge et al. 2003; Dew and Wilcox 2011). To under-
                                       stand why, recall from Chapter 5 that a dyad (two persons) provides greater intimacy
                                       than a triad (after adding a third person, interaction must be shared). In addition, the
                                       birth of a child unbalances the life that the couple has worked out. To move from the
                                       abstract to the concrete, think about the implications for marriage of coping with a
                                       fragile newborn’s 24-hour-a-day needs of being fed, soothed, and diapered—while the
                                       parents have less sleep and greater expenses.
                                          Marital happiness increases when the last child reaches age 6, when the child starts
                                       school and is away from home a lot. This happiness is short-lived, though, and takes a
                                       nosedive when the child reaches age 12 or 13. You can figure this one out—the devil
                                       years of adolescence. But those years don’t last forever (although many parents think
                                       they will), and happiness increases again when the last child gets through the troubled,
                                       rebellious years (Senior 2010).
   400   401   402   403   404   405   406   407   408   409   410