Page 13 - Technical s (Designing of online monitoring tools) for Measles Follow-up- campaign in Sudan
P. 13

WHO –Technical Support on Measles Follow-up Campaign in Sudan 2019


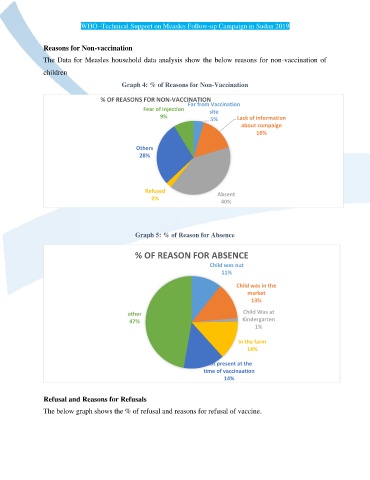
               Reasons for Non-vaccination

               The Data for Measles household data analysis show the below reasons for non-vaccination of
               children

                                         Graph 4: % of Reasons for Non-Vaccination

                                  % OF REASONS FOR NON-VACCINATION
                                                               Far from Vaccination
                                                Fear of Injection
                                                                      site
                                                      9%                       Lack of information
                                                                       5%
                                                                                 about compaign
                                                                                      16%

                                              Others
                                               28%


                                                 Refused                 Absent
                                                   2%
                                                                          40%


                                              Graph 5: % of Reason for Absence


                                              % OF REASON FOR ABSENCE
                                                                      Child was out
                                                                          11%
                                                                               Child was in the
                                                                                   market
                                                                                    13%

                                           other                                 Child Was at
                                            47%                                  Kindergarten
                                                                                     1%

                                                                                In the farm
                                                                                   14%
                                                                     Not present at the
                                                                    time of vaccinaation
                                                                           14%


               Refusal and Reasons for Refusals
               The below graph shows the % of refusal and reasons for refusal of vaccine.
   8   9   10   11   12   13   14   15   16   17   18