
Page 73 - BJS vol. 36
P. 73
Productivity of Soybean-Mungbean Sequential Intercropping ............ Sugarcane 65
Cane juice quality and sugar yield
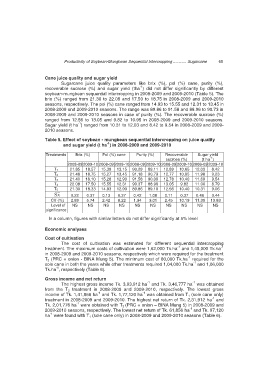
Sugarcane juice quality parameters like brix (%), pol (%) cane, purity (%),
-1
recoverable sucrose (%) and sugar yield (tha ) did not differ significantly by different
soybean-mungbean sequential intercropping in 2008-2009 and 2009-2010 (Table 5). The
brix (%) ranged from 21.30 to 22.08 and 17.50 to 18.75 in 2008-2009 and 2009-2010
seasons, respectively. The pol (%) cane ranged from 14.93 to 15.55 and 12.31 to 13.45 in
2008-2009 and 2009-2010 seasons. The range was 89.86 to 91.58 and 88.96 to 90.73 in
2008-2009 and 2009-2010 seasons in case of purity (%). The recoverable sucrose (%)
ranged from 12.56 to 13.05 and 9.82 to 10.95 in 2008-2009 and 2009-2010 seasons.
-1
Sugar yield (t ha ) ranged from 10.31 to 12.03 and 8.42 to 9.54 in 2008-2009 and 2009-
2010 seasons.
Table 5. Effect of soybean - mungbean sequential intercropping on juice quality
-1
and sugar yield (t ha ) in 2008-2009 and 2009-2010
Treatments Brix (%) Pol (%) cane Purity (%) Recoverable Sugar yield
-1
sucrose (%) (t ha )
2008-09 2009-10 2008-09 2009-10 2008-09 2009-10 2008-09 2009-10 2008-09 2009-10
T 1 21.85 18.57 15.39 13.15 90.29 89.11 12.89 10.65 12.03 8.42
T 2 21.48 18.75 15.27 13.45 91.18 90.73 12.77 10.95 11.98 9.23
T 3 21.40 18.10 15.28 12.90 91.58 90.09 12.78 10.40 11.69 9.54
T 4 22.08 17.50 15.55 12.31 90.37 88.96 13.05 9.82 11.00 8.79
T 5 21.30 18.33 14.93 12.90 89.86 89.10 12.56 10.40 10.31 9.06
S x 0.22 0.37 0.13 0.37 0.42 1.08 0.11 0.37 0.46 0.44
CV (%) 2.89 5.74 2.42 8.22 1.34 3.01 2.45 10.19 11.39 13.83
Level of NS NS NS NS NS NS NS NS NS NS
significance
In a column, figures with similar letters do not differ significantly at 5% level
Economic analyses
Cost of cultivation
The cost of cultivation was estimated for different sequential intercropping
-1
treatment. The maximum costs of cultivation were 1,62,000 Tk.ha and 1,45,000 Tk.ha -1
in 2008-2009 and 2009-2010 seasons, respectively which were required for the treatment
-1
T 2 (PRC + onion - BINA Mung 5). The minimum cost of 80,000 Tk.ha required for the
-1
sole cane in both the years while other treatments required 1,04,000 Tk.ha and 1,06,000
-1
Tk.ha , respectively (Table 6).
Gross income and net return
-1
-1
The highest gross income Tk. 3,93,912 ha and Tk. 3,46,777 ha was obtained
from the T 2 treatment in 2008-2009 and 2009-2010, respectively. The lowest gross
-1
-1
income of Tk. 1,41,856 ha and Tk. 1,77,120 ha was obtained from T 1 (sole cane only)
-1
treatment in 2008-2009 and 2009-2010. The highest net return of Tk. 2,31,912 ha and
-1
Tk. 2,01,776 ha were obtained with T 2 (PRC + onion – BINA Mung 5) in 2008-2009 and
-1
2009-2010 seasons, respectively. The lowest net return of Tk. 61,856 ha and Tk. 97,120
-1
ha were found with T 1 (sole cane only) in 2008-2009 and 2009-2010 seasons (Table 6).