
Page 74 - BJS vol. 36
P. 74
66 Bangladesh J. Sugarcane, 36 : 59-68 June, 2015
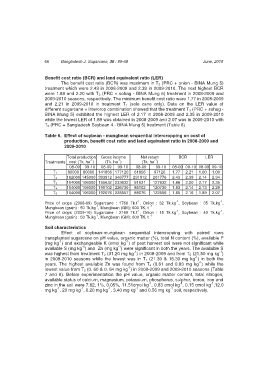
Benefit cost ratio (BCR) and land equivalent ratio (LER)
The benefit cost ratio (BCR) was maximum in T 2 (PRC + onion - BINA Mung 5)
treatment which were 2.43 in 2008-2009 and 2.39 in 2009-2010. The next highest BCR
were 1.88 and 2.20 with T 3 (PRC + sohag - BINA Mung 5) treatment in 2008-2009 and
2009-2010 seasons, respectively. The minimum benefit cost ratio were 1.77 in 2008-2009
and 2.21 in 2009-2010 in treatment T 1 (sole cane only). Data on the LER value of
different sugarcane + intercrop combination showed that the treatment T 3 (PRC + sohag -
BINA Mung 5) exhibited the highest LER of 2.17 in 2008-2009 and 2.35 in 2009-2010
while the lowest LER of 1.89 was obtained in 2008-2009 and 2.07 was in 2009-2010 with
T 5 (PRC + Bangladesh Soybean 4 - BINA Mung 5) treatment (Table 6).
Table 6. Effect of soybean - mungbean sequential intercropping on cost of
production, benefit cost ratio and land equivalent ratio in 2008-2009 and
2009-2010
Total production Gross income Net return BCR LER
-1
-1
-1
Treatments cost (Tk. ha ) (Tk. ha ) (Tk. ha )
08-09 09-10 08-09 09-10 08-09 09-10 08-09 09-10 08-09 09-10
T 1 80000 80000 141856 177120 61856 97120 1.77 2.21 1.00 1.00
T 2 162000 145000 393912 346777 231912 201776 2.43 2.39 2.14 2.34
T 3 104000 106000 195632 233632 91631 127632 1.88 2.20 2.17 2.35
T 4 104000 106000 190102 226730 86102 120730 1.83 2.14 2.13 2.29
T 5 104000 106000 192076 228557 88076 122556 1.85 2.16 1.89 2.07
-1
-1
-1
Price of crops (2008-09) Sugarcane : 1760 Tk.t , Onion : 32 Tk.kg , Soybean : 35 Tk.kg ,
-1
-1
Mungbean (grain) : 50 Tk.kg , Mungbean (GM): 600 TK. t
-1
-1
-1
Price of crops (2009-10) Sugarcane : 2160 Tk.t , Onion : 15 Tk.kg , Soybean : 40 Tk.kg ,
-1
-1
Mungbean (grain) : 50 Tk.kg , Mungbean (GM): 600 TK. t
Soil characteristics
Effect of soybean-mungbean sequential intercropping with paired rows
transplanted sugarcane on pH value, organic matter (%), total N content (%), available P
-1
-1
(mg kg ) and exchangeable K (cmol kg ) of post harvest soil were not significant while
-1
-1
available S (mg kg ) and Zn (mg kg ) were significant in both the years. The available S
-1
-1
was highest from treatment T 2 (31.20 mg kg ) in 2008-2009 and from T 5 (21.50 mg kg )
-1
in 2009-2010 seasons while the lowest was in T 1 (21.30 & 16.30 mg kg ) in both the
-1
years. The highest available Zn was found from T 4 (0.81 and 0.83 mg kg ) while the
-1
lowest value from T 5 (0. 60 & 0. 64 mg kg ) in 2008-2009 and 2009-2010 seasons (Table
7 and 8). Before experimentation the pH value, organic matter content, total nitrogen,
available status of calcium, magnesium, potassium, phosphorus, sulphur, boron, iron and
-1
-1
-1
zinc in the soil were 7.62, 1%, 0.05%, 11.51cmol kg , 0.83 cmol kg , 0.15 cmol kg ,12.0
-1
-1
-1
-1
-1
mg kg , 20 mg kg , 0.20 mg kg , 3.40 mg kg and 0.56 mg kg soil, respectively.