
Page 74 - BJS vol. 35
P. 74
66 Bangladesh J. Sugarcane, 35 : 60-72 June, 2014
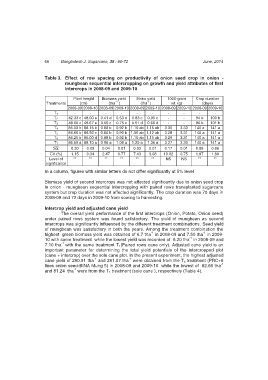
Table 3. Effect of row spacing on productivity of onion seed crop in onion -
mungbean sequential intercropping on growth and yield attributes of first
intercrops in 2008-09 and 2009-10
Plant height Biomass yield Straw yield 1000-grain Crop duration
-1
-1
Treatments (cm) (tha ) (tha ) wt. (g) (days)
2008-09 2009-10 2008-09 2009-10 2008-09 2009-10 2008-09 2009-10 2008-09 2009-10
T 1 - - - - - - - - - -
T 2 42.33 c 48.00 e 0.41 d 0.53 d 0.83 c 0.95 c - - 94 b 100 b
T 3 48.00 c 49.67 e 0.66 c 0.75 c 0.51 d 0.66 d - - 96 b 101 b
T 4 85.00 b 88.15 b 0.88 b 0.92 b 1.10 ab 1.15 ab 3.30 3.33 140 a 141 a
T 5 84.66 b 86.50 c 0.80 b 0.90 b 1.00 ab 1.12 ab 3.28 3.31 140 a 141 a
T 6 84.25 b 85.00 d 0.88 b 0.92 b 1.10 ab 1.15 ab 3.29 3.31 140 a 141 a
T 7 86.50 a 89.10 a 0.96 a 1.08 a 1.20 a 1.35 a 3.27 3.30 140 a 141 a
S x 0.30 0.09 0.04 0.01 0.03 0.01 0.17 0.01 0.88 0.86
CV (%) 1.15 0.34 2.47 0.77 7.43 3.08 19.02 0.75 1.97 1.89
Level of ** ** ** ** ** ** NS NS ** **
significance
In a column, figures with similar letters do not differ significantly at 5% level
Biomass yield of second intercrops was not affected significantly due to onion seed crop
in onion - mungbean sequential intercropping with paired rows transplanted sugarcane
system but crop duration was not affected significantly. The crop duration was 70 days in
2008-09 and 72 days in 2009-10 from sowing to harvesting.
Intercrop yield and adjusted cane yield
The overall yield performance of the first intercrops (Onion, Potato, Onion seed)
under paired rows system was found satisfactory. The yield of mungbean as second
intercrops was significantly influenced by the different treatment combinations. Seed yield
of mungbean was satisfactory in both the years. Among the treatment combination the
-1
-1
highest green biomass yield was obtained of 6.7 tha in 2008-09 and 7.50 tha in 2009-
-1
10 with same treatment while the lowest yield was recorded of 6.20 tha in 2008-09 and
-1
7.10 tha with the same treatment T 1 (Paired rows cane only). Adjusted cane yield is an
important parameter for determining the total yield potentials of the intercropped plot
(cane + intercrop) over the sole cane plot. In the present experiment, the highest adjusted
-1
-1
cane yield of 290.91 tha and 281.07 tha were obtained from the T 6 treatment (PRC+6
lines onion seed-BINA Mung 5) in 2008-09 and 2009-10 while the lowest of 82.66 tha -1
-1
and 81.24 tha were from the T 1 treatment (sole cane ), respectively (Table 4).