Page 77 - BJS vol. 35
P. 77

Productivity and Profitability of Onion Seed Crop-Mungbean ......... Sugarcane   69


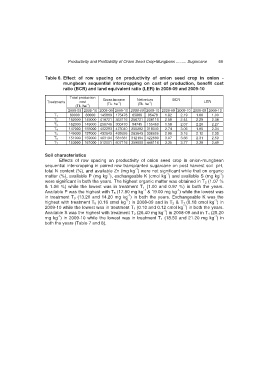
                     Table 6.  Effect  of  row  spacing  on  productivity  of  onion  seed  crop  in  onion  -
                             mungbean  sequential  intercropping  on  cost  of  production,  benefit  cost
                             ratio (BCR) and land equivalent ratio (LER) in 2008-09 and 2009-10
                                Total production
                      Treatments    cost       Gross income   Net return      BCR           LER
                                                     -1
                                                                   -1

                                                              (Tk. ha )
                                                (Tk. ha )
                                        -1
                                   (Tk. ha )
                               2008-09  2009-10  2008-09  2009-10  2008-09  2009-10  2008-09  2009-10  2008-09  2009-10
                         T 1    80000   80000   145869  175478   65868   95478   1.82   2.19   1.00   1.00
                         T 2    162000  145000  418721  353116  256721  208116   2.58   2.44   2.29   2.38
                         T 3    162000  145000  256746  300470   94745   155469   1.58   2.07   2.20   2.27
                         T 4    147000  155000  402293  473040  255292  318040   2.74   3.05   1.95   2.34
                         T 5    149000  157000  432643  495626  283643  338626   2.90   3.16   2.12   2.39
                         T 6    151000  159000  463194  581681  312194  422680   3.07   3.66   2.31   2.59
                         T 7    153000  161000  512001  607116  359000  446116   3.35   3.77   2.30   2.49
                     Soil characteristics
                           Effects  of  row  spacing  on  productivity  of  onion  seed  crop  in  onion-mungbean
                     sequential intercropping in paired row transplanted sugarcane on post harvest soil  pH,
                                                             -1
                     total N content (%), and available Zn (mg kg ) were not significant while that on organic
                                                 -1
                                                                                                   -1
                                                                           -1
                     matter (%), available P (mg kg ), exchangeable K (cmol kg ) and available S (mg kg )
                     were significant in both the years. The highest organic matter was obtained in T 2  (1.07 %
                     &  1.06  %)  while  the  lowest  was  in  treatment  T 1   (1.00  and  0.97  %)  in  both  the  years.
                                                                                -1
                                                                 -1
                     Available P was the highest with T 6  (17.80 mg kg  & 19.00 mg kg ) while the lowest was
                                                          -1
                     in treatment T 3  (13.20 and 14.20 mg kg ) in both the years. Exchangeable  K  was the
                                                                                                -1
                                                         -1
                     highest with treatment T 5  (0.16 cmol kg ) in 2008-09 and in T 2  & T 7  (0.18 cmol kg ) in
                                                                                  -1
                     2009-10 while the lowest was in treatment T 1  (0.10 and 0.12 cmol kg ) in both the years.
                                                                          -1
                     Available S was the highest with treatment T 2  (26.40 mg kg ) in 2008-09 and in T 4  (25.20
                                                                                                -1
                           -1
                     mg kg ) in 2009-10 while the lowest was in treatment T 1  (18.50 and 21.20 mg kg ) in
                     both the years (Table 7 and 8).
   72   73   74   75   76   77   78   79   80   81   82