
Page 12 - AMANGO 2017 CASE STUDY 2
P. 12
P a ge | 11
So = 3.5S1 + 1.8S2 + 0.25S3 + 0.69S4
Where:
S1 = Earnings before interest and tax / market value of equity
S2 = Working capital / medium and long term capital employed
S3 = Market value of equity / market value of debt
S4 = Present value to infinity of current operating free cash flow / turnover
So < 0 High probability of failure (downgrade up to 3 notches to junk status)
0<So<0.5 Remedial action required to improve (status watch, or a notch or 2 down)
So > 0.5 High probability of survival in next 3 years (up to 3 notches up, or investment grade)
===END OF THE 5 ISSUES YOU MUST SOLVE…SUPPORTING APPENDICES NOW FOLLOW===
KEY DATA – APPENDIX 1
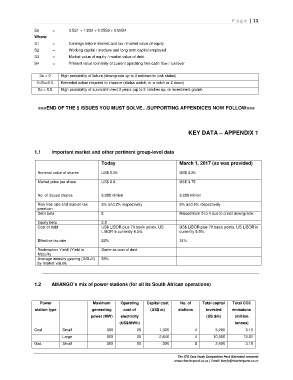
1.1 Important market and other pertinent group-level data
Today March 1, 2017 (as was provided)
Nominal value of shares US$ 0.25 US$ 0.25
Market price per share US$ 8.8 US$ 3.75
No. of issued shares 3,088 million 3,088 million
Risk free rate and market risk 3% and 2% respectively 3% and 5% respectively
premium
Debt beta 2 Raised from 0 to 4 due to credit downgrade.
Equity beta 3.5
Cost of debt US$ LIBOR plus 70 basis points. US US$ LIBOR plus 70 basis points. US LIBOR is
LIBOR is currently 4.3%. currently 5.5%.
Effective tax rate 22% 31%
Redemption Yield/ (Yield to Same as cost of debt
Maturity
Average industry gearing (D/D+E) 58%
by market values
1.2 AMANGO’s mix of power stations (for all its South African operations)
Power Maximum Operating Capital cost No. of Total capital Total CO2
station type generating cost of (US$ m) stations invested emissions
power (MW) electricity (US $m) (million
(US$/MWh) tonnes)
Coal Small 300 25 1,320 4 5,280 3.15
Large 600 25 2,640 4 10,560 12.61
Gas Small 300 50 300 8 2,400 3.15
The CFO Case Study Competition Pack (Extended scenario)
www.charterquest.co.za | Email: thecfo@charterquest.co.za