Page 45 - FINAL CFA I SLIDES JUNE 2019 DAY 11
P. 45

LOS 41.h: Explain the selection of an optimal            Session Unit 12:
         portfolio, given an investor’s utility (or risk          41. Portfolio Risk and Return: Part 1
         aversion) and the capital allocation line., p.137


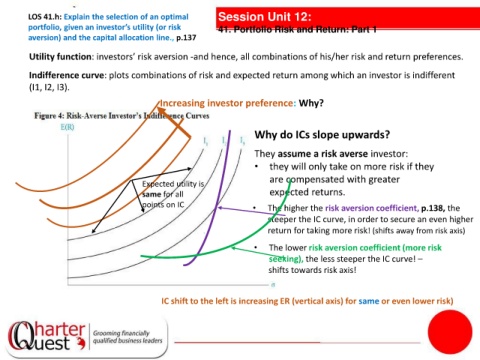
          Utility function: investors’ risk aversion -and hence, all combinations of his/her risk and return preferences.

          Indifference curve: plots combinations of risk and expected return among which an investor is indifferent

          (I1, I2, I3).
                                                 Increasing investor preference: Why?


                                                                             Why do ICs slope upwards?
                                                         tanties
                                                                             They assume a risk averse investor:
                                                                             •
                                                                                  they will only take on more risk if they
                                                                                  are compensated with greater
                                            Expected utility is
                                            same for all                          expected returns.
                                            points on IC                     •   The higher the risk aversion coefficient, p.138, the
                                                                                 steeper the IC curve, in order to secure an even higher
                                                                                 return for taking more risk! (shifts away from risk axis)

                                                                             •    The lower risk aversion coefficient (more risk

                                                                                  seeking), the less steeper the IC curve! –
                                                                                  shifts towards risk axis!


                                                 IC shift to the left is increasing ER (vertical axis) for same or even lower risk)
   40   41   42   43   44   45   46   47   48