
Page 21 - CIMA MCS Workbook February 2019 - Day 1 Suggested Solutions
P. 21
SUGGESTED SOLUTIONS
CHAPTER SIX
1. ANALYSIS OF PERFORMANCE AND POSITION
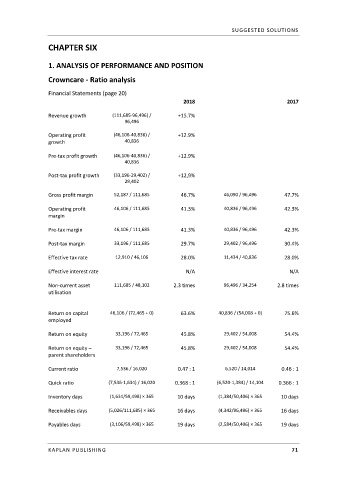
Crowncare ‐ Ratio analysis
Financial Statements (page 20)
2018 2017
Revenue growth (111,685‐96,496) / +15.7%
96,496
Operating profit (46,106‐40,836) / +12.9%
growth 40,836
Pre‐tax profit growth (46,106‐40,836) / +12.9%
40,836
Post‐tax profit growth (33,196‐29,402) / +12,9%
29,402
Gross profit margin 52,187 / 111,685 46.7% 46,090 / 96,496 47.7%
Operating profit 46,106 / 111,685 41.3% 40,836 / 96,496 42.3%
margin
Pre‐tax margin 46,106 / 111,685 41.3% 40,836 / 96,496 42.3%
Post‐tax margin 33,196 / 111,685 29.7% 29,402 / 96,496 30.4%
Effective tax rate 12,910 / 46,106 28.0% 11,434 / 40,836 28.0%
Effective interest rate N/A N/A
Non‐current asset 111,685 / 48,102 2.3 times 96,496 / 34,254 2.8 times
utilisation
Return on capital 46,106 / (72,465 + 0) 63.6% 40,836 / (54,008 + 0) 75.6%
employed
Return on equity 33,196 / 72,465 45.8% 29,402 / 54,008 54.4%
Return on equity – 33,196 / 72,465 45.8% 29,402 / 54,008 54.4%
parent shareholders
Current ratio 7,536 / 16,020 0.47 : 1 6,520 / 14,014 0.46 : 1
Quick ratio (7,536‐1,634) / 16,020 0.368 : 1 (6,520‐1,384) / 14,104 0.366 : 1
Inventory days (1,634/59,498) × 365 10 days (1,384/50,406) × 365 10 days
Receivables days (5,026/111,685) × 365 16 days (4,342/96,496) × 365 16 days
Payables days (3,106/59,498) × 365 19 days (2,584/50,406) × 365 19 days
KAPLAN PUBLISHING 71