
Page 25 - CIMA MCS Workbook February 2019 - Day 1 Suggested Solutions
P. 25
SUGGESTED SOLUTIONS
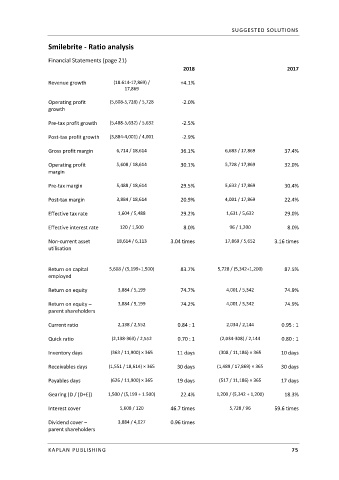
Smilebrite ‐ Ratio analysis
Financial Statements (page 21)
2018 2017
Revenue growth (18.614‐17,869) / +4.1%
17,869
Operating profit (5,608‐5,728) / 5,728 ‐2.0%
growth
Pre‐tax profit growth (5,488‐5,632) / 5,632 ‐2.5%
Post‐tax profit growth (3,884‐4,001) / 4,001 ‐2.9%
Gross profit margin 6,714 / 18,614 36.1% 6,683 / 17,869 37.4%
Operating profit 5,608 / 18,614 30.1% 5,728 / 17,869 32.0%
margin
Pre‐tax margin 5,488 / 18,614 29.5% 5,632 / 17,869 30.4%
Post‐tax margin 3,884 / 18,614 20.9% 4,001 / 17,869 22.4%
Effective tax rate 1,604 / 5,488 29.2% 1,631 / 5,632 29.0%
Effective interest rate 120 / 1,500 8.0% 96 / 1,200 8.0%
Non‐current asset 18,614 / 6,113 3.04 times 17,869 / 5,652 3.16 times
utilisation
Return on capital 5,608 / (5,199+1,500) 83.7% 5,728 / (5,342+1,200) 87.5%
employed
Return on equity 3,884 / 5,199 74.7% 4,001 / 5,342 74.9%
Return on equity – 3,884 / 5,199 74.2% 4,001 / 5,342 74.9%
parent shareholders
Current ratio 2,138 / 2,552 0.84 : 1 2,034 / 2,144 0.95 : 1
Quick ratio (2,138‐363) / 2,552 0.70 : 1 (2,034‐308) / 2,144 0.80 : 1
Inventory days (363 / 11,900) × 365 11 days (308 / 11,186) × 365 10 days
Receivables days (1,551 / 18,614) × 365 30 days (1,489 / 17,869) × 365 30 days
Payables days (626 / 11,900) × 365 19 days (517 / 11,186) × 365 17 days
Gearing (D / (D+E)) 1,500 / (5,199 + 1.500) 22.4% 1,200 / (5,342 + 1,200) 18.3%
Interest cover 5,608 / 120 46.7 times 5,728 / 96 59.6 times
Dividend cover – 3,884 / 4,027 0.96 times
parent shareholders
KAPLAN PUBLISHING 75