
Page 228 - E2 Integrated Workbook STUDENT 2018
P. 228
Chapter 15
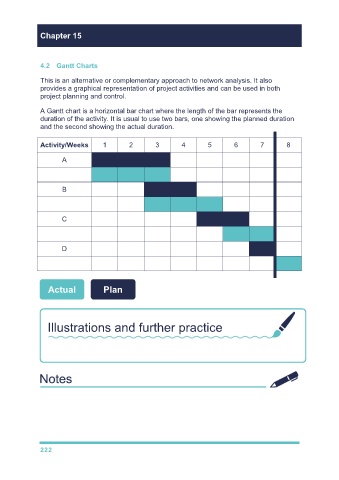
4.2 Gantt Charts
This is an alternative or complementary approach to network analysis. It also
provides a graphical representation of project activities and can be used in both
project planning and control.
A Gantt chart is a horizontal bar chart where the length of the bar represents the
duration of the activity. It is usual to use two bars, one showing the planned duration
and the second showing the actual duration.
Activity/Weeks 1 2 3 4 5 6 7 8
A
B
C
D
Actual Plan
Illustrations and further practice
Try case study style question 2 from Chapter 15 of the Study Text.
222