
Page 162 - BA2 Integrated Workbook - Student 2017
P. 162
Chapter 11
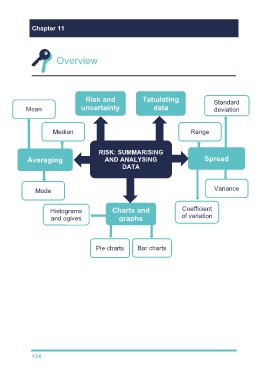
Overview
Risk and Tabulating Standard
Mean uncertainty data deviation
Median Range
RISK: SUMMARISING
Averaging AND ANALYSING Spread
DATA
Mode Variance
Histograms Charts and Coefficient
and ogives graphs of variation
Pie charts Bar charts
154