
Page 51 - BA2 Integrated Workbook - Student 2017
P. 51
Analysing and predicting costs
5.2 Correlation coefficient
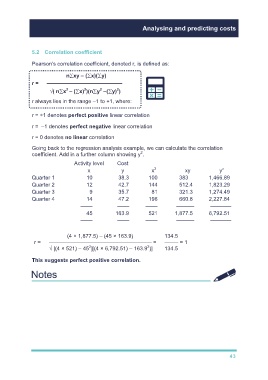
Pearson’s correlation coefficient, denoted r, is defined as:
n∑xy – (∑x)(∑y)
r = ——————————————
√( n∑x – (∑x) )(n∑y –(∑y) )
2
2
2
2
r always lies in the range –1 to +1, where:
r = +1 denotes perfect positive linear correlation
r = –1 denotes perfect negative linear correlation
r = 0 denotes no linear correlation
Going back to the regression analysis example, we can calculate the correlation
2
coefficient. Add in a further column showing y .
Activity level Cost
2
x y x xy y
2
Quarter 1 10 38.3 100 383 1,466.89
Quarter 2 12 42.7 144 512.4 1,823.29
Quarter 3 9 35.7 81 321.3 1,274.49
Quarter 4 14 47.2 196 660.8 2,227.84
–––– –––– –––– –––––– –––––––
45 163.9 521 1,877.5 6,792.51
–––– –––– –––– –––––– –––––––
(4 × 1,877.5) – (45 × 163.9) 134.5
r = ——————————————————— = ——– = 1
2
2
√ [(4 × 521) − 45 ][(4 × 6,792.51) – 163.9 )] 134.5
This suggests perfect positive correlation.
TYU 5
43