
Page 46 - BA2 Integrated Workbook - Student 2017
P. 46
Chapter 3
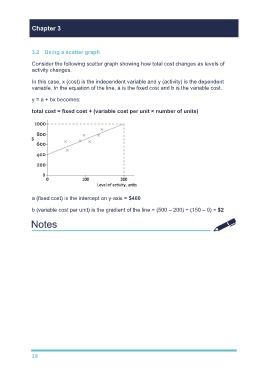
3.2 Using a scatter graph
Consider the following scatter graph showing how total cost changes as levels of
activity changes.
In this case, x (cost) is the independent variable and y (activity) is the dependent
variable. In the equation of the line, a is the fixed cost and b is the variable cost.
y = a + bx becomes:
total cost = fixed cost + (variable cost per unit × number of units)
a (fixed cost) is the intercept on y-axis = $400
b (variable cost per unit) is the gradient of the line = (500 – 200) ÷ (150 – 0) = $2
38