Page 462 - SBR Integrated Workbook STUDENT S18-J19
P. 462

Chapter 25


                   Example 2 – continued


                                                                                             $m

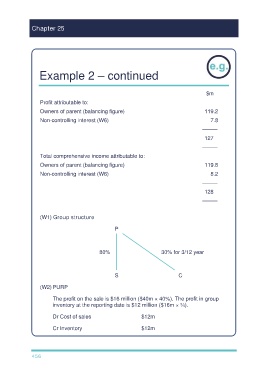
                   Profit attributable to:
                   Owners of parent (balancing figure)                                      119.2
                   Non-controlling interest (W6)                                               7.8

                                                                                           –––––
                                                                                            127

                                                                                           –––––
                   Total comprehensive income attributable to:

                   Owners of parent (balancing figure)                                      119.8
                   Non-controlling interest (W6)                                               8.2

                                                                                           –––––
                                                                                            128

                                                                                           –––––

                   (W1) Group structure

                                                    P


                                             80%                         30% for 3/12 year


                                                    S                           C


                   (W2) PURP

                        The profit on the sale is $16 million ($40m × 40%). The profit in group
                        inventory at the reporting date is $12 million ($16m × ¾).

                        Dr Cost of sales                        $12m

                        Cr Inventory                            $12m


               456
   457   458   459   460   461   462   463   464   465   466   467