
Page 478 - SBR Integrated Workbook STUDENT S18-J19
P. 478
Chapter 25
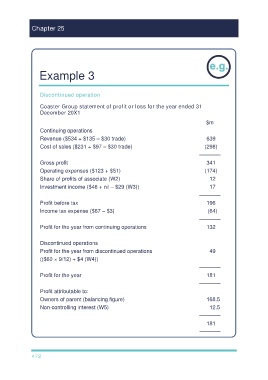
Example 3
Discontinued operation
Coaster Group statement of profit or loss for the year ended 31
December 20X1
$m
Continuing operations
Revenue ($534 + $135 – $30 trade) 639
Cost of sales ($231 + $97 – $30 trade) (298)
–––––––
Gross profit 341
Operating expenses ($123 + $51) (174)
Share of profits of associate (W2) 12
Investment income ($46 + nil – $29 (W3)) 17
–––––––
Profit before tax 196
Income tax expense ($67 – $3) (64)
–––––––
Profit for the year from continuing operations 132
Discontinued operations
Profit for the year from discontinued operations 49
(($60 × 9/12) + $4 (W4))
–––––––
Profit for the year 181
–––––––
Profit attributable to:
Owners of parent (balancing figure) 168.5
Non-controlling interest (W5) 12.5
–––––––
181
–––––––
472