
Page 22 - CIMA May 18 - MCS Day 1 Suggested Solution
P. 22
CIMA MAY 2018 – MANAGEMENT CASE STUDY
CHAPTER SIX
EXERCISE 1
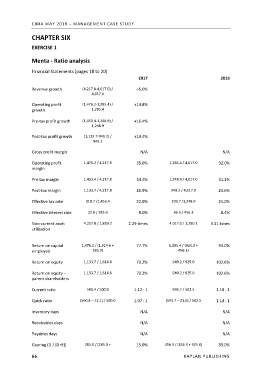
Menta ‐ Ratio analysis
Financial Statements (pages 18 to 20)
2017 2016
Revenue growth (4,217.8‐4,017.0) / +5.0%
4,017.0
Operating profit (1,476.2‐1,285.4) / +14.8%
growth 1,285.4
Pre‐tax profit growth (1,453.4‐1,248.9) / +16.4%
1,248.9
Post‐tax profit growth (1,133.7‐949.2) / +19.4%
949.2
Gross profit margin N/A N/A
Operating profit 1,476.2 / 4,217.8 35.0% 1,285.4 / 4,017.0 32.0%
margin
Pre‐tax margin 1,453.4 / 4,217.8 34.4% 1,248.9 / 4,017.0 31.1%
Post‐tax margin 1,133.7 / 4,217.8 26.9% 949.2 / 4,017.0 23.6%
Effective tax rate 319.7 /1,453.4 22.0% 299.7 /1,248.9 24.0%
Effective interest rate 22.8 / 285.0 8.0% 36.5 / 456.3 8.4%
Non‐current asset 4,217.8 / 1,839.2 2.29 times 4.017.0 / 1,290.1 3.11 times
utilisation
Return on capital 1,476.2 / (1,614.6 + 77.7% 1,285.4 / (925.0 + 93.0%
employed 285.0) 456.3)
Return on equity 1,133.7 / 1,614.6 70.2% 949.2 / 925.0 102.6%
Return on equity – 1,133.7 / 1,614.6 70.2% 949.2 / 925.0 102.6%
parent shareholders
Current ratio 560.4 / 500.0 1.12 : 1 593.7 / 502.5 1.18 : 1
Quick ratio (560.4 – 22.1) / 500.0 1.07 : 1 (593.7 – 21.6) / 502.5 1.14 : 1
Inventory days N/A N/A
Receivables days N/A N/A
Payables days N/A N/A
Gearing (D / (D+E)) 285.0 / (285.0 + 15.0% 456.3 / (456.3 + 925.0) 33.0%
66 KAPLAN PUBLISHING