
Page 24 - CIMA May 18 - MCS Day 1 Suggested Solution
P. 24
CIMA MAY 2018 – MANAGEMENT CASE STUDY
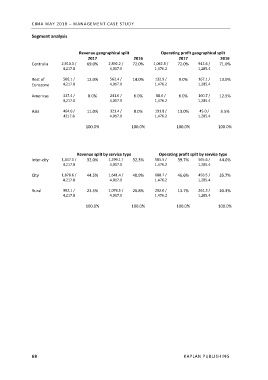
Segment analysis
Revenue geographical split Operating profit geographical split
2017 2016 2017 2016
Centralia 2,910.3 / 69.0% 2,892.2 / 72.0% 1,062.9 / 72.0% 912.6 / 71.0%
4,217.8 4,017.0 1,476.2 1,285.4
Rest of 506.1 / 12.0% 562.4 / 14.0% 132.9 / 9.0% 167.1 / 13.0%
Eurozone 4,217.8 4,017.0 1,476.2 1,285.4
Americas 337.4 / 8.0% 241.0 / 6.0% 88.6 / 6.0% 160.7 / 12.5%
4,217.8 4,017.0 1,476.2 1,285.4
Asia 464.0 / 11.0% 321.4 / 8.0% 191.8 / 13.0% 45.0 / 3.5%
4217.8 4,017.0 1,476.2 1,285.4
100.0% 100.0% 100.0% 100.0%
Revenue split by service type Operating profit split by service type
Inter‐city 1,347.1 / 32.0% 1,299.1 / 32.3% 585.5 / 39.7% 565.6 / 44.0%
4,217.8 4,017.0 1,476.2 1,285.4
City 1,878.6 / 44.5% 1,641.4 / 40.9% 688.7 / 46.6% 458.5 / 35.7%
4,217.8 4,017.0 1,476.2 1,285.4
Rural 992.1 / 23.5% 1,076.5 / 26.8% 202.0 / 13.7% 261.3 / 20.3%
4,217.8 4,017.0 1,476.2 1,285.4
100.0% 100.0% 100.0% 100.0%
68 KAPLAN PUBLISHING