
Page 28 - CIMA May 18 - MCS Day 1 Suggested Solution
P. 28
CIMA MAY 2018 – MANAGEMENT CASE STUDY
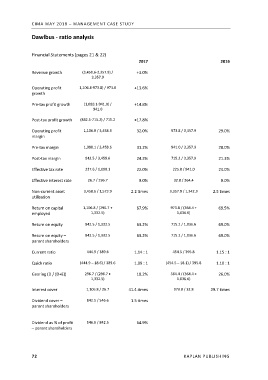
Dawlbus ‐ ratio analysis
Financial Statements (pages 21 & 22)
2017 2016
Revenue growth (3,458.6‐3,357.9) / +3.0%
3,357.9
Operating profit 1,106.8‐973.8) / 973.8 +13.6%
growth
Pre‐tax profit growth (1,080.1‐941.0) / +14.8%
941.0
Post‐tax profit growth (842.5‐715.2) / 715.2 +17.8%
Operating profit 1,106.8 / 3,458.6 32.0% 973.8 / 3,357.9 29.0%
margin
Pre‐tax margin 1,080.1 / 3,458.6 31.2% 941.0 / 3,357.9 28.0%
Post‐tax margin 842.5 / 3,458.6 24.3% 715.2 / 3,357.9 21.3%
Effective tax rate 237.6 / 1,080.1 22.0% 225.8 / 941.0 24.0%
Effective interest rate 26.7 / 296.7 9.0% 32.8 / 364.4 9.0%
Non‐current asset 3,458.6 / 1,573.9 2.2 times 3,357.9 / 1,342.3 2.5 times
utilisation
Return on capital 1,106.8 / (296.7 + 67.9% 973.8 / (364.4 + 69.5%
employed 1,332.5) 1,036.6)
Return on equity 842.5 / 1,332.5 63.2% 715.2 / 1,036.6 69.0%
Return on equity – 842.5 / 1,332.5 63.2% 715.2 / 1,036.6 69.0%
parent shareholders
Current ratio 444.9 / 389.6 1.14 : 1 454.5 / 395.8 1.15 : 1
Quick ratio (444.9 – 18.6) / 389.6 1.09 : 1 (454.5 – 18.1) / 395.8 1.10 : 1
Gearing (D / (D+E)) 296.7 / (296.7 + 18.2% 364.4 / (364.4 + 26.0%
1,332.5) 1.036.6)
Interest cover 1,106.8 / 26.7 41.4.times 973.8 / 32.8 29.7 times
Dividend cover – 842.5 / 546.6 1.5 times
parent shareholders
Dividend as % of profit 546.6 / 842.5 64.9%
– parent shareholders
72 KAPLAN PUBLISHING