
Page 18 - FINAL CFA II SLIDES JUNE 2019 DAY 2
P. 18
LOS 7.j: Describe the use of analysis of variance
(ANOVA) in regression analysis, interpret ANOVA MODULE 7.5: ANOVA TABLES, R , AND SEE
2
results, and calculate and interpret the F-statistic.
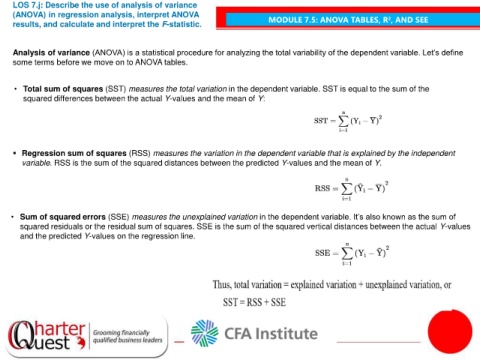
Analysis of variance (ANOVA) is a statistical procedure for analyzing the total variability of the dependent variable. Let’s define
some terms before we move on to ANOVA tables.
• Total sum of squares (SST) measures the total variation in the dependent variable. SST is equal to the sum of the
squared differences between the actual Y-values and the mean of Y:
▪ Regression sum of squares (RSS) measures the variation in the dependent variable that is explained by the independent
variable. RSS is the sum of the squared distances between the predicted Y-values and the mean of Y.
• Sum of squared errors (SSE) measures the unexplained variation in the dependent variable. It’s also known as the sum of
squared residuals or the residual sum of squares. SSE is the sum of the squared vertical distances between the actual Y-values
and the predicted Y-values on the regression line.