
Page 21 - FINAL CFA II SLIDES JUNE 2019 DAY 2
P. 21
THE F-STATISTIC MODULE 7.5: ANOVA TABLES, R , AND SEE
2
An F-test assesses how well a set of independent variables, as a group, explains the variation in the dependent variable. In
multiple regression, the F-statistic is used to test whether at least one independent variable in a set of independent variables
explains a significant portion of the variation of the dependent variable. We will discuss the use of the F-test in multiple
regression with more than one independent variable in the next topic review.
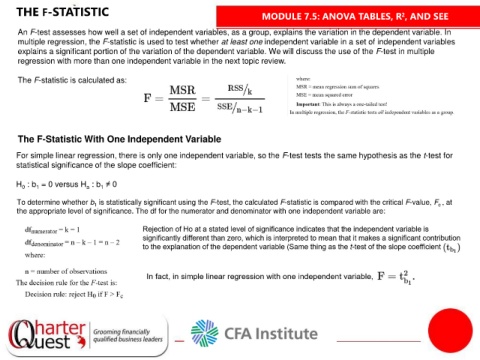
The F-statistic is calculated as:
The F-Statistic With One Independent Variable
For simple linear regression, there is only one independent variable, so the F-test tests the same hypothesis as the t-test for
statistical significance of the slope coefficient:
H : b = 0 versus H : b ≠ 0
a
1
1
0
To determine whether b is statistically significant using the F-test, the calculated F-statistic is compared with the critical F-value, F , at
c
1
the appropriate level of significance. The df for the numerator and denominator with one independent variable are: