
Page 24 - FINAL CFA II SLIDES JUNE 2019 DAY 2
P. 24
LOS 8.a: Formulate a multiple regression equation to READING 8: MULTIPLE REGRESSION AND ISSUES IN REGRESSION ANALYSIS
describe the relation between a dependent variable and
several independent variables and determine the MODULE 8.1: MULTIPLE REGRESSION: INTRODUCTION
statistical significance of each independent variable.
1
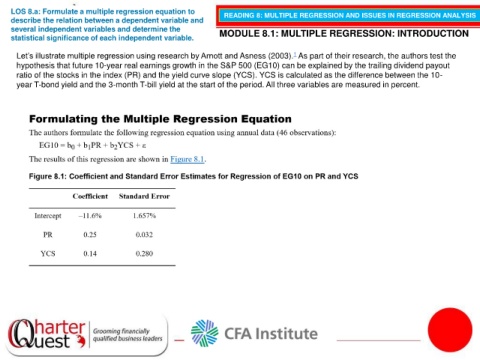
Let’s illustrate multiple regression using research by Arnott and Asness (2003). As part of their research, the authors test the
hypothesis that future 10-year real earnings growth in the S&P 500 (EG10) can be explained by the trailing dividend payout
ratio of the stocks in the index (PR) and the yield curve slope (YCS). YCS is calculated as the difference between the 10-
year T-bond yield and the 3-month T-bill yield at the start of the period. All three variables are measured in percent.