
Page 19 - FINAL CFA II SLIDES JUNE 2019 DAY 2
P. 19
LOS 7.j: Describe the use of analysis of variance
2
(ANOVA) in regression analysis, interpret ANOVA MODULE 7.5: ANOVA TABLES, R , AND SEE
results, and calculate and interpret the F-statistic.
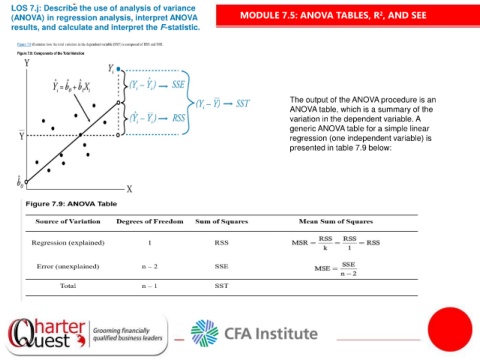
The output of the ANOVA procedure is an
ANOVA table, which is a summary of the
variation in the dependent variable. A
generic ANOVA table for a simple linear
regression (one independent variable) is
presented in table 7.9 below: