
Page 28 - FINAL CFA II SLIDES JUNE 2019 DAY 2
P. 28
LOS 8.b: lets return to p-values
READING 8: MULTIPLE REGRESSION AND ISSUES IN REGRESSION ANALYSIS
MODULE 8.2: HYPOTHESIS TESTS AND CONFIDENCE INTERVALS
Recap from CFA Level I on p value!
LOS 12.f: Explain and interpret the p-value as it relates to hypothesis testing
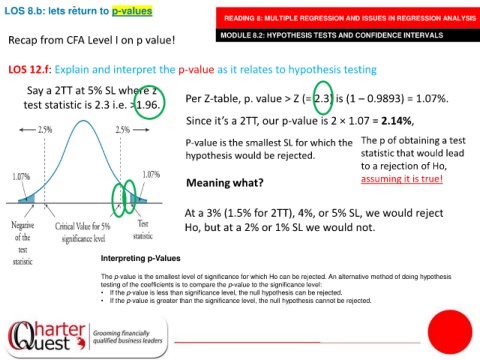
Say a 2TT at 5% SL where z
Per Z-table, p. value > Z (= 2.3) is (1 – 0.9893) = 1.07%.
test statistic is 2.3 i.e. >1.96.
Since it’s a 2TT, our p-value is 2 × 1.07 = 2.14%,
P-value is the smallest SL for which the The p of obtaining a test
hypothesis would be rejected. statistic that would lead
to a rejection of Ho,
Meaning what? assuming it is true!
At a 3% (1.5% for 2TT), 4%, or 5% SL, we would reject
Ho, but at a 2% or 1% SL we would not.
Interpreting p-Values
The p-value is the smallest level of significance for which Ho can be rejected. An alternative method of doing hypothesis
testing of the coefficients is to compare the p-value to the significance level:
• If the p-value is less than significance level, the null hypothesis can be rejected.
• If the p-value is greater than the significance level, the null hypothesis cannot be rejected.