
Page 31 - FINAL CFA II SLIDES JUNE 2019 DAY 2
P. 31
READING 8: MULTIPLE REGRESSION AND ISSUES IN REGRESSION ANALYSIS
Lets return to LOS 8b: p-values MODULE 8.2: HYPOTHESIS TESTS AND CONFIDENCE INTERVALS
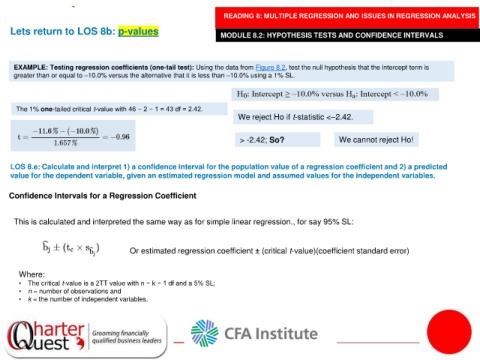
EXAMPLE: Testing regression coefficients (one-tail test): Using the data from Figure 8.2, test the null hypothesis that the intercept term is
greater than or equal to –10.0% versus the alternative that it is less than –10.0% using a 1% SL.
The 1% one-tailed critical t-value with 46 − 2 − 1 = 43 df = 2.42.
We reject Ho if t-statistic <–2.42.
> -2.42; So? We cannot reject Ho!
LOS 8.e: Calculate and interpret 1) a confidence interval for the population value of a regression coefficient and 2) a predicted
value for the dependent variable, given an estimated regression model and assumed values for the independent variables.
Confidence Intervals for a Regression Coefficient
This is calculated and interpreted the same way as for simple linear regression., for say 95% SL:
Or estimated regression coefficient ± (critical t-value)(coefficient standard error)
Where:
• The critical t-value is a 2TT value with n − k − 1 df and a 5% SL;
• n = number of observations and
• k = the number of independent variables.