
Page 32 - FINAL CFA II SLIDES JUNE 2019 DAY 2
P. 32
LOS 8.e: Calculate and interpret 1) a confidence READING 8: MULTIPLE REGRESSION AND ISSUES IN REGRESSION ANALYSIS
interval for the population value of a regression
coefficient and 2) a predicted value for the MODULE 8.2: HYPOTHESIS TESTS AND CONFIDENCE INTERVALS
dependent variable, given an estimated
regression model and assumed values for the
independent variables.
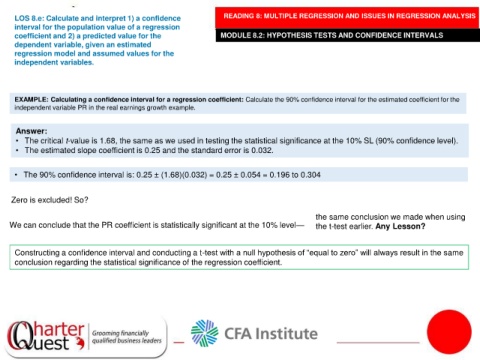
EXAMPLE: Calculating a confidence interval for a regression coefficient: Calculate the 90% confidence interval for the estimated coefficient for the
independent variable PR in the real earnings growth example.
Answer:
• The critical t-value is 1.68, the same as we used in testing the statistical significance at the 10% SL (90% confidence level).
• The estimated slope coefficient is 0.25 and the standard error is 0.032.
• The 90% confidence interval is: 0.25 ± (1.68)(0.032) = 0.25 ± 0.054 = 0.196 to 0.304
Zero is excluded! So?
the same conclusion we made when using
We can conclude that the PR coefficient is statistically significant at the 10% level— the t-test earlier. Any Lesson?
Constructing a confidence interval and conducting a t-test with a null hypothesis of “equal to zero” will always result in the same
conclusion regarding the statistical significance of the regression coefficient.