
Page 33 - FINAL CFA II SLIDES JUNE 2019 DAY 2
P. 33
LOS 8.e: Calculate and interpret 1) a confidence READING 8: MULTIPLE REGRESSION AND ISSUES IN REGRESSION ANALYSIS
interval for the population value of a regression
coefficient and 2) a predicted value for the MODULE 8.2: HYPOTHESIS TESTS AND CONFIDENCE INTERVALS
dependent variable, given an estimated
regression model and assumed values for the
independent variables.
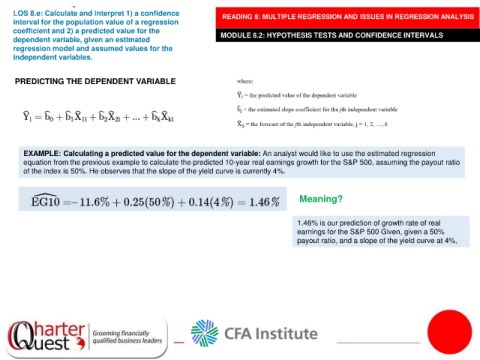
PREDICTING THE DEPENDENT VARIABLE
EXAMPLE: Calculating a predicted value for the dependent variable: An analyst would like to use the estimated regression
equation from the previous example to calculate the predicted 10-year real earnings growth for the S&P 500, assuming the payout ratio
of the index is 50%. He observes that the slope of the yield curve is currently 4%.
Meaning?
1.46% is our prediction of growth rate of real
earnings for the S&P 500 Given, given a 50%
payout ratio, and a slope of the yield curve at 4%,