
Page 162 - BA2 Integrated Workbook STUDENT 2018
P. 162
Chapter 9
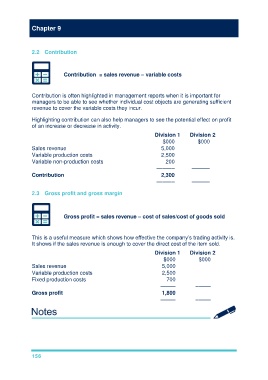
2.2 Contribution
Contribution = sales revenue – variable costs
Contribution is often highlighted in management reports when it is important for
managers to be able to see whether individual cost objects are generating sufficient
revenue to cover the variable costs they incur.
Highlighting contribution can also help managers to see the potential effect on profit
of an increase or decrease in activity.
Division 1 Division 2
$000 $000
Sales revenue 5,000 3,000
Variable production costs 2,500 800
Variable non-production costs 200 150
–––––– ––––––
Contribution 2,300 2,050
–––––– ––––––
2.3 Gross profit and gross margin
Gross profit = sales revenue – cost of sales/cost of goods sold
This is a useful measure which shows how effective the company’s trading activity is.
It shows if the sales revenue is enough to cover the direct cost of the item sold.
Division 1 Division 2
$000 $000
Sales revenue 5,000 3,000
Variable production costs 2,500 800
Fixed production costs 700 500
––––– –––––
Gross profit 1,800 1,700
––––– –––––
156