
Page 246 - BA2 Integrated Workbook STUDENT 2018
P. 246
Chapter 13
Breakeven charts
3.1 Conventional breakeven chart
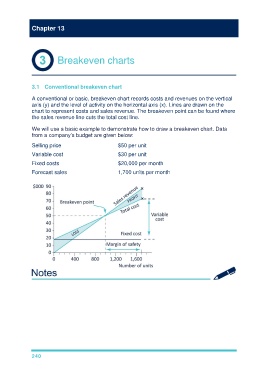
A conventional or basic, breakeven chart records costs and revenues on the vertical
axis (y) and the level of activity on the horizontal axis (x). Lines are drawn on the
chart to represent costs and sales revenue. The breakeven point can be found where
the sales revenue line cuts the total cost line.
We will use a basic example to demonstrate how to draw a breakeven chart. Data
from a company’s budget are given below:
Selling price $50 per unit
Variable cost $30 per unit
Fixed costs $20,000 per month
Forecast sales 1,700 units per month
240