
Page 207 - Microsoft Word - 00 ACCA F2 Prelims.docx
P. 207
Statistical techniques
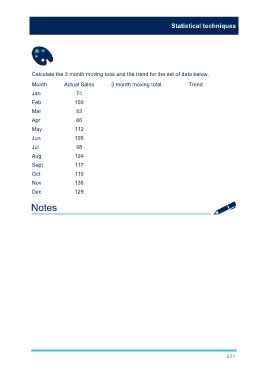
Calculate the 3 month moving total and the trend for the set of data below.
Month Actual Sales 3 month moving total Trend
Jan 74 0 0
Feb 100 267 (W1) 89 (W2)
Mar 93 279 93 (W3)
Apr 86 291 97
May 112 303 101
Jun 105 315 105
Jul 98 327 109
Aug 124 339 113
Sept 117 351 117
Oct 110 363 121
Nov 136 375 125
Dec 129 0 0
Working 1
74 + 100 + 93 = 267
Working 2
267/3 = 89 this represents the trend value for February
Working 3
(100 + 93 + 86)/3 = 93 this represents the trend value for March
201