
Page 16 - CIMA SCS Workbook November 2018 - Day 1 Suggested Solutions
P. 16
CIMA NOVEMBER 2018 – STRATEGIC CASE STUDY
Chapter Six – F3
EXERCISE 1
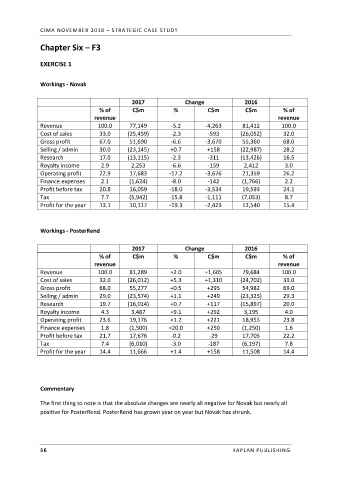
Workings - Novak
2017 Change 2016
% of C$m % C$m C$m % of
revenue revenue
Revenue 100.0 77,149 -5.2 -4,263 81,412 100.0
Cost of sales 33.0 (25,459) -2.3 -593 (26,052) 32.0
Gross profit 67.0 51,690 -6.6 -3,670 55,360 68.0
Selling / admin 30.0 (23,145) +0.7 +158 (22,987) 28.2
Research 17.0 (13,115) -2.3 -311 (13,426) 16.5
Royalty income 2.9 2,253 -6.6 -159 2,412 3.0
Operating profit 22.9 17,683 -17.2 -3,676 21,359 26.2
Finance expenses 2.1 (1,624) -8.0 -142 (1,766) 2.2
Profit before tax 20.8 16,059 -18.0 -3,534 19,593 24.1
Tax 7.7 (5,942) -15.8 -1,111 (7,053) 8.7
Profit for the year 13.1 10,117 -19.3 -2,423 12,540 15.4
Workings - PosterRend
2017 Change 2016
% of C$m % C$m C$m % of
revenue revenue
Revenue 100.0 81,289 +2.0 +1,605 79,684 100.0
Cost of sales 32.0 (26,012) +5.3 +1,310 (24,702) 31.0
Gross profit 68.0 55,277 +0.5 +295 54,982 69.0
Selling / admin 29.0 (23,574) +1.1 +249 (23,325) 29.3
Research 19.7 (16,014) +0.7 +117 (15,897) 20.0
Royalty income 4.3 3,487 +9.1 +292 3,195 4.0
Operating profit 23.6 19,176 +1.2 +221 18,955 23.8
Finance expenses 1.8 (1,500) +20.0 +250 (1,250) 1.6
Profit before tax 21.7 17,676 -0.2 -29 17,705 22.2
Tax 7.4 (6,010) -3.0 -187 (6,197) 7.8
Profit for the year 14.4 11,666 +1.4 +158 11,508 14.4
Commentary
The first thing to note is that the absolute changes are nearly all negative for Novak but nearly all
positive for PosterRend. PosterRend has grown year on year but Novak has shrunk.
56 KAPLAN PUBLISHING