
Page 18 - CIMA SCS Workbook November 2018 - Day 1 Suggested Solutions
P. 18
CIMA NOVEMBER 2018 – STRATEGIC CASE STUDY
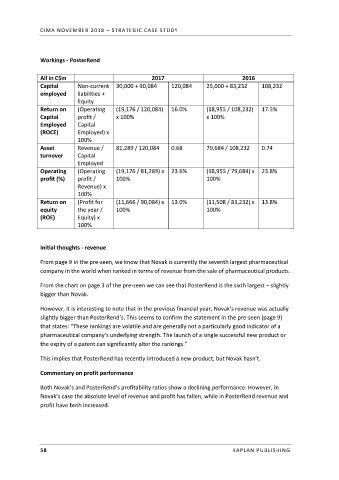
Workings - PosterRend
All in C$m 2017 2016
Capital Non-current 30,000 + 90,084 120,084 25,000 + 83,232 108,232
employed liabilities +
Equity
Return on (Operating (19,176 / 120,084) 16.0% (18,955 / 108,232) 17.5%
Capital profit / x 100% x 100%
Employed Capital
(ROCE) Employed) x
100%
Asset Revenue / 81,289 / 120,084 0.68 79,684 / 108,232 0.74
turnover Capital
Employed
Operating (Operating (19,176 / 81,289) x 23.6% (18,955 / 79,684) x 23.8%
profit (%) profit / 100% 100%
Revenue) x
100%
Return on (Profit for (11,666 / 90,084) x 13.0% (11,508 / 83,232) x 13.8%
equity the year / 100% 100%
(ROE) Equity) x
100%
Initial thoughts - revenue
From page 9 in the pre-seen, we know that Novak is currently the seventh largest pharmaceutical
company in the world when ranked in terms of revenue from the sale of pharmaceutical products.
From the chart on page 3 of the pre-seen we can see that PosterRend is the sixth largest – slightly
bigger than Novak.
However, it is interesting to note that in the previous financial year, Novak’s revenue was actually
slightly bigger than PosterRend’s. This seems to confirm the statement in the pre-seen (page 9)
that states: “These rankings are volatile and are generally not a particularly good indicator of a
pharmaceutical company’s underlying strength. The launch of a single successful new product or
the expiry of a patent can significantly alter the rankings.”
This implies that PosterRend has recently introduced a new product, but Novak hasn’t.
Commentary on profit performance
Both Novak’s and PosterRend’s profitability ratios show a declining performance. However, in
Novak’s case the absolute level of revenue and profit has fallen, while in PosterRend revenue and
profit have both increased.
58 KAPLAN PUBLISHING