
Page 17 - CIMA SCS Workbook November 2018 - Day 1 Suggested Solutions
P. 17
SUGGESTED SOLUTIONS
Looking at the line by line comparison of % of revenue, it is striking how similar the two
companies are in many areas. For example, cost of sales and selling / administration expenses
represent (almost) the same proportion of revenue in both companies and year on year.
The key differences between the two companies are in research spending and royalty income.
PosterRend spends a higher proportion of its revenue on research, and it has increased the
absolute spend year on year while Novak has reduced the amount spent. In this industry, research
is vital to make sure a company doesn’t fall behind its competitors, so it is worrying that Novak
spends less than PosterRend.
Also, PosterRend generates a larger amount of royalty income each year, helping to improve its
profitability.
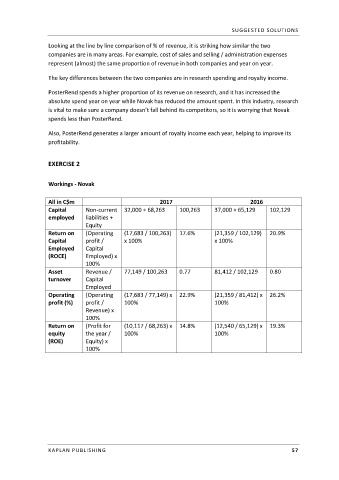
EXERCISE 2
Workings - Novak
All in C$m 2017 2016
Capital Non-current 32,000 + 68,263 100,263 37,000 + 65,129 102,129
employed liabilities +
Equity
Return on (Operating (17,683 / 100,263) 17.6% (21,359 / 102,129) 20.9%
Capital profit / x 100% x 100%
Employed Capital
(ROCE) Employed) x
100%
Asset Revenue / 77,149 / 100,263 0.77 81,412 / 102,129 0.80
turnover Capital
Employed
Operating (Operating (17,683 / 77,149) x 22.9% (21,359 / 81,412) x 26.2%
profit (%) profit / 100% 100%
Revenue) x
100%
Return on (Profit for (10,117 / 68,263) x 14.8% (12,540 / 65,129) x 19.3%
equity the year / 100% 100%
(ROE) Equity) x
100%
KAPLAN PUBLISHING 57