
Page 19 - FINAL CFA SLIDES DECEMBER 2018 DAY 3
P. 19
Session Unit 2:
8. Statistical Concepts and Market Returns (C)
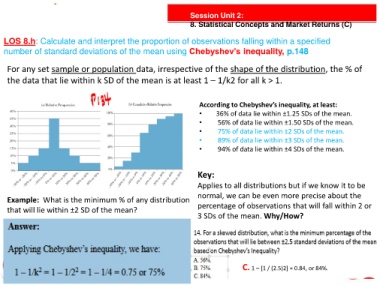
LOS 8.h: Calculate and interpret the proportion of observations falling within a specified
number of standard deviations of the mean using Chebyshev’s inequality, p.148
For any set sample or population data, irrespective of the shape of the distribution, the % of
the data that lie within k SD of the mean is at least 1 – 1/k2 for all k > 1.
According to Chebyshev’s inequality, at least:
• 36% of data lie within ±1.25 SDs of the mean.
• 56% of data lie within ±1.50 SDs of the mean.
• 75% of data lie within ±2 SDs of the mean.
• 89% of data lie within ±3 SDs of the mean.
• 94% of data lie within ±4 SDs of the mean.
Key:
Applies to all distributions but if we know it to be
normal, we can be even more precise about the
Example: What is the minimum % of any distribution
that will lie within ±2 SD of the mean? percentage of observations that will fall within 2 or
3 SDs of the mean. Why/How?
C. 1 – [1 / (2.5)2] = 0.84, or 84%.