
Page 20 - FINAL CFA I SLIDES JUNE 2019 DAY 3
P. 20
LOS 9.k: Calculate and interpret Session Unit 2:
covariance and correlation, p.183
9. Probability Concepts
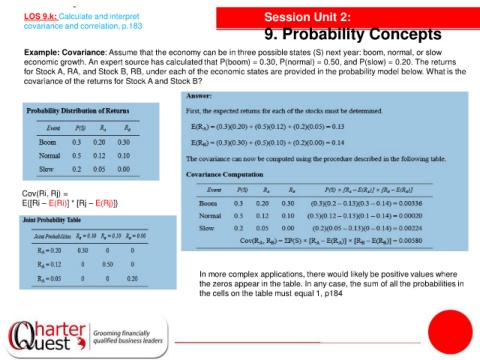
Example: Covariance: Assume that the economy can be in three possible states (S) next year: boom, normal, or slow
economic growth. An expert source has calculated that P(boom) = 0.30, P(normal) = 0.50, and P(slow) = 0.20. The returns
for Stock A, RA, and Stock B, RB, under each of the economic states are provided in the probability model below. What is the
covariance of the returns for Stock A and Stock B?
Cov(Ri, Rj) =
E{[Ri – E(Ri)] * [Rj – E(Rj)]}
In more complex applications, there would likely be positive values where
the zeros appear in the table. In any case, the sum of all the probabilities in
the cells on the table must equal 1, p184