
Page 18 - FINAL CFA I SLIDES JUNE 2019 DAY 3
P. 18
Session Unit 2:
9. Probability Concepts
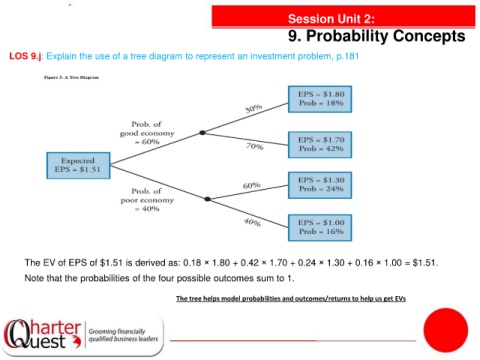
LOS 9.j: Explain the use of a tree diagram to represent an investment problem, p.181
The EV of EPS of $1.51 is derived as: 0.18 × 1.80 + 0.42 × 1.70 + 0.24 × 1.30 + 0.16 × 1.00 = $1.51.
Note that the probabilities of the four possible outcomes sum to 1.
The tree helps model probabilities and outcomes/returns to help us get EVs