
Page 21 - CombinedTest_Neat
P. 21
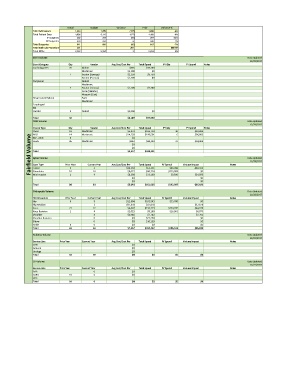
Actual Budget Variance Prior Variance %
Total Admissions 1,243 1,370 (127) 1,200 -9%
Total Patient Days 4,636 5,113 (477) 4,489 -9%
IP Surgeries 202 258 (56) 207 -22%
OP Surgeries 439 433 6 640 1%
Total Surgeries 641 691 (50) 847 -7%
Total Cath Lab Procedures 201 201 #DIV/0!
Total EIPAs 2,383 2,380 3 2,294 0%
Stent Volume Data Updated
12/29/2017
Stent Category Qty Vendor Avg Cost/Cost Per Total Spend PY Qty PY Spend Notes
Cardiology DES 28 Abbott $685 $19,180
Medtronic $1,100 $0
7 Boston (Synergy) $1,250 $8,750
Boston (Promus) $1,100 $0
Peripheral Abbott
Medtronic
7 Boston ( Innova) $1,100 $7,700
Gore (Viabahn)
Maquet (iCast)
Drug Coated Balloon Bard
Medtronic
Esophogeal
Bili
Carotid 0 Abbott $1,900 $0
Total 42 $1,189 $35,630
CRM Volume Data Updated
12/29/2017
Device Type Qty Vendor Avg Cost/Cost Per Total Spend PY Qty PY Spend Notes
$5,873
Pacer 18 0 Medtronic $14,250 $105,710 10 6 $39,883
Medtronic
$199,501
AICD
14
$96,803
Fairfield Volume Total Prior Year Current Year Avg Cost/Cost Per $0 Total Spend PY Spend Volume Impact Notes Data Updated
$0
BIV - AICD
$982
Leads
Medtronic
45
$44,190
23
$28,488
$0
$3,517
$349,401
Spine Volume
12/28/2017
Case Type
9
Fusion
$10,230
$68,498
5
$9,672
10
$0
$96,724
Stimulator
10
$24,893
Min Invasive
4
$9,500
$8,298
1
$33,190
$0 $51,151 $115,909 -$40,921
$0
$0 $0
Total 20 19 $5,640 $181,065 $193,907 -$16,028
Orthopedic Volume Data Updated
12/28/2017
TJR Procedure Prior Year Current Year Avg Cost/Cost Per Total Spend PY Spend Volume Impact Notes
Hip 9 9 $11,394 $102,545 $55,780 $0
Hip Revision 1 $37,878 $37,878 $37,878
Knee 23 32 $4,897 $156,713 $103,782 $44,076
Knee Revision 1 4 $2,025 $8,100 $26,981 $6,075
Shoulder 4 $1,946 $7,782 $7,782
Shoulder Revision 0 $0 $21,250 $0
Elbow 0 $0 $10,199 $0
Ankle 0 0 $0 $0 $0
Total 33 50 $7,267 $344,467 $186,543 $95,810
Robotics Volume Data Updated
12/22/2017
Service Line Prior Year Current Year Avg Cost/Cost Per Total Spend PY Spend Volume Impact Notes
GYN $0
General $0
Urology $0
Total 33 39 $0 $0 $0 $0
CV Volume Data Updated
12/22/2017
Service Line Prior Year Current Year Avg Cost/Cost Per Total Spend PY Spend Volume Impact Notes
AAA 0 $0
CABG 10 6 $0
CTO
Total 10 6 $0 $0 $0 $0