
Page 24 - CombinedTest_Neat
P. 24
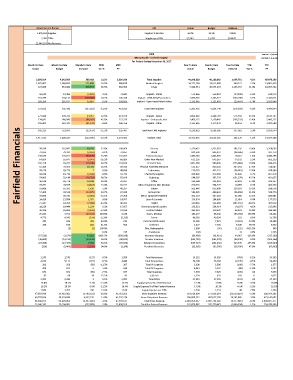
Actual Current Period KPI Actual Budget Variance
3,676,914 Supplies Supplies % Net Rev 16.2% 18.3% 2.06%
2,383 EIPAs Supplies per EIPA $1,543 $1,783 $240.02
22,646,193 Net Revenue
6304 RUN DATE: 1/10/2018
Mercy Health - Fairfield Hospital RUN TIME: 8:18:46 AM
For Periods Ending December 31, 2017
Month To Date Month To Date Month To Date MTD MTD Year To Date Year To Date Year To Date YTD YTD
Actual Budget Variance Var % PY Actual Budget Variance Var % PY
3,676,914 4,242,567 565,653 13.3% 3,529,896 Total Supplies 46,098,532 48,166,283 2,067,751 4.3% 47,075,159
1,075,067 1,286,876 211,809 16.5% 986,879 Medical Surgical 14,171,258 14,511,480 340,222 2.3% 13,981,416
324,266 940,860 616,594 65.5% 962,906 Drugs 9,388,941 10,544,294 1,155,353 11.0% 10,054,462
50,643 48,460 (2,183) -4.5% 74,683 Implant - Stents 572,866 558,818 (14,048) -2.5% 619,973
353,799 203,133 (150,666) -74.2% 145,338 Implant - CRM AICD/Pacemakers 2,476,501 2,343,321 (133,180) -5.7% 2,342,011
168,150 183,837 15,687 8.5% 198,895 Implant - Open Heart/Heart Valves 2,152,065 2,122,601 (29,464) -1.4% 2,032,860
572,592 435,430 (137,162) -31.5% 418,915 Total CRM Implants 5,201,432 5,024,740 (176,692) -3.5% 4,994,844
174,828 199,785 24,957 12.5% 213,976 Implant - Spinal 1,692,822 2,268,764 575,942 25.4% 2,184,727
274,692 188,680 (86,012) -45.6% 252,736 Implant - Orthopedic Joint 2,406,175 2,139,842 (266,333) -12.4% 2,460,237
Implant - Other
(31,370)
364,434
468,756
-8.6%
4,384,580
4,179,978
28,352
4,151,626
395,804 1,188,329 (229,586) -12.3% 1,354,382 Total Non-CRM Implants 13,452,055 13,613,325 337,962 0.7% 14,024,388
Fairfield Financials 158,586 116,882 125,011 70,434 (33,575) (25,746) (26,758) 38,293 7 -26.9% 100,969 Minor Equipment Non-Medical 1,170,432 1,386,243 1,061,580 844,503 1,351,687 1,405,905 815,997 (175,084) (161,579) 181,256 -19.8% 1,268,606
845,323
9,029,544
3.9%
935,467
8,250,623
752,899
(92,424)
8,588,585
1.2%
-19.3%
Implant Total
1,417,915
161,270
Dietary
13.4%
78,590
32.8%
-3.1%
(28,506)
-3.5%
72,857
Blood
927,770
(2,162)
72,595
Endomechanical
19,662
1.4%
1,440,198
131,357
55,847
5.3%
611,126
645,367
(9,047)
68,884
-16.2%
64,894
663,139
34,241
Other Non-Medical
834,416
110,016
IV and IV Sets
102,118
76,372
886,496
-33.7%
307,931
Physical Plant/Maintenance
819,358
724,987
18,784
49,343
37.6%
70,953
26.5%
511,427
52,169
48,898
0.0%
Laboratory
39,276
452,725
39,270
478,389
(58,010)
-12.8%
510,735
31,442
457,278
6.7%
470,268
Chemistry Supplies
31,792
438,826
40,730
-8.6%
44,238
(3,508)
59,906
544,307
Radiology
-80.7%
33,148
87,019
382,728
-42.2%
451,057
10,248
311,410
Office
16,528
38.3%
26,776
17.0%
22,437
52,823
258,588
323,157
405,776
65,511
28,928
7.2%
(4,463)
310,726
-15.4%
24,003
334,729
33,391
1,616
2.9%
19.2%
Suture
449,633
39,533
52,468
(96,394)
Instruments
(12,935)
546,026
67,138
347,283
41,960
29,358
12.1%
-12.1%
33,894
30,230
305,323
14,429
1,565
Linen & Laundry
9.8%
6.0%
14,705
173,654
15,994
11,014
184,668
222,864
27,247
330,016
19,265
-41.4%
40,292
-48.1%
Freight
(7,982)
-4.1%
53,666 55,282 (3,664) -32.7% 48,297 Minor Equipment Medical 505,446 625,609 (107,152) 120,163 -21.4% 588,516 504,774 443,681 177,573 307,619 215,896
233,621
15,455
19,444
(9,107)
224,514
6.3%
1,224
18,220
Housekeeping & Laundry
30,336 26,893 (3,443) -12.8% 21,539 Contrast Media 263,914 310,507 46,593 15.0% 294,265
25,433 7,711 (17,721) -229.8% 3,338 Gases, Medical 182,277 88,542 (93,734) -105.9% 60,342
4,775 4,241 (534) -12.6% (2,325) Forms 49,302 49,554 252 0.5% 31,756
385 686 301 43.9% 832 Fuel (aircraft & auto) 12,186 7,925 (4,261) -53.8% 10,498
394 674 281 41.6% 930 Uniforms 2,437 7,785 5,348 68.7% 9,952
- (2) (2) 100.0% - Film, Radiographic 1,099 (26) (1,125) 4335.2% 549
- - - 0.0% 715 Anesthesia (32) - 32 0.0% 3,735
(57,526) (3,674) 53,852 -1465.7% (690,586) Inventory Variance (86,488) (42,421) 44,067 -103.9% (717,362)
(38,802) (51,215) (12,412) 24.2% (46,012) Premier Incentive (532,702) (591,333) (58,630) 9.9% (562,168)
(27,208) (17,429) 9,780 -56.1% (65,840) Rebates & Incentives (514,727) (201,232) 313,495 -155.8% (263,524)
(328) (5,488) (5,159) 94.0% (1,190) Purchase Discounts (33,565) (63,360) (29,796) 47.0% (65,983)
1,243 1,370 (127) -9.3% 1,200 Total Admissions 14,132 14,895 (763) -5.1% 14,359
4,636 5,113 (477) -9.3% 4,489 Total Patient Days 54,198 56,768 (2,570) -4.5% 54,454
202 258 (56) -21.7% 207 Total IP Surgeries 2,396 2,596 (200) -7.7% 2,577
439 433 6 1.4% 640 Total OP Surgeries 4,943 5,032 (89) -1.8% 5,262
641 691 (50) -7.3% 847 Total Surgeries 7,339 7,629 (290) (0) 7,839
87 69 18 25.2% 91 Cath Lab 1,124 931 193 0 1,027
2,383 2,380 3 0.1% 2,294 Total EIPAs 27,049 27,483 (434) (0) 27,149
16.0% 18.1% -2.1% -11.4% 16.2% Supply Expense % of Net Revenue 17.3% 17.9% -0.6% -3.3% 18.0%
16.2% 18.3% -2.0% -11.2% 16.4% Supply Expense % of Net Patient Revenue 17.5% 18.1% -0.6% -3.2% 18.2%
1,543 1,783 240 13.4% 1,539 Supply Expense per EIPA 1,704 1,753 48 2.8% 1,734
47,659,840 53,429,362 (5,769,521) -10.8% 45,761,263 Gross Inpatient Revenue 554,516,604 577,056,264 (22,539,659) -3.9% 528,954,385
43,707,034 39,374,699 4,332,335 11.0% 41,732,274 Gross Outpatient Revenue 506,839,252 487,677,258 19,161,995 3.9% 471,143,092
91,366,875 92,804,061 (1,437,186) -1.5% 87,493,537 Total Gross Revenue 1,061,355,857 1,064,733,522 (3,377,665) -0.3% 1,000,097,477
22,646,193 23,204,082 (557,889) -2.4% 21,490,556 Total Net Patient Revenue 262,876,087 265,770,481 (2,894,394) -1.1% 258,289,399