
Page 3 - Neighborhood Report
P. 3
Huntington Beach, California
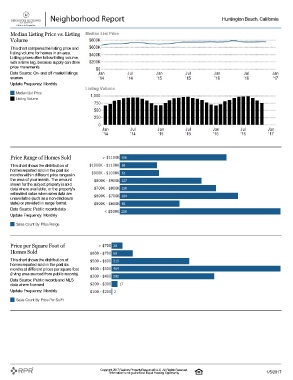
Median Listing Price vs. Listing
Volume
This chart compares the listing price and
listing volume for homes in an area.
Listing prices often follow listing volume,
with a time lag, because supply can drive
price movements.
Data Source: On- and off-market listings
sources
Update Frequency: Monthly
Median List Price
Listing Volume
Price Range of Homes Sold
This chart shows the distribution of
homes reported sold in the past six
months within different price ranges in
the area of your search. The amount
shown for the subject property is sold
data where available, or the property's
estimated value when sales data are
unavailable (such as a non-disclosure
state) or provided in range format.
Data Source: Public records data
Update Frequency: Monthly
Sales Count By Price Range
Price per Square Foot of
Homes Sold
This chart shows the distribution of
homes reported sold in the past six
months at different prices per square foot
(living area sourced from public records).
Data Source: Public records and MLS
data where licensed
Update Frequency: Monthly
Sales Count By Price Per Sq Ft
Copyright 2017 Realtors Property Resource® LLC. All Rights Reserved.
Information is not guaranteed. Equal Housing Opportunity. 1/5/2017