
Page 7 - Neighborhood Report
P. 7
Huntington Beach, California
Neighborhood: Economic Stats and Charts
Huntington Beach Orange County California USA
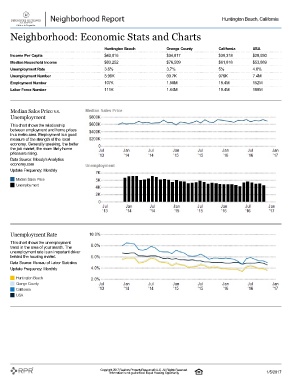
Income Per Capita $43,016 $34,817 $30,318 $28,930
Median Household Income $83,252 $76,509 $61,818 $53,889
Unemployment Rate 3.6% 3.7% 5% 4.6%
Unemployment Number 3.99K 60.7K 976K 7.4M
Employment Number 107K 1.58M 18.4M 152M
Labor Force Number 111K 1.64M 19.4M 159M
Median Sales Price vs.
Unemployment
This chart shows the relationship
between employment and home prices
in a metro area. Employment is a good
measure of the strength of the local
economy. Generally speaking, the better
the job market, the more likely home
prices are rising.
Data Source: Moody's Analytics:
economy.com
Update Frequency: Monthly
Median Sales Price
Unemployment
Unemployment Rate
This chart shows the unemployment
trend in the area of your search. The
unemployment rate is an important driver
behind the housing market.
Data Source: Bureau of Labor Statistics
Update Frequency: Monthly
Huntington Beach
Orange County
California
USA
Copyright 2017 Realtors Property Resource® LLC. All Rights Reserved.
Information is not guaranteed. Equal Housing Opportunity. 1/5/2017