
Page 9 - Neighborhood Report
P. 9
Huntington Beach, California
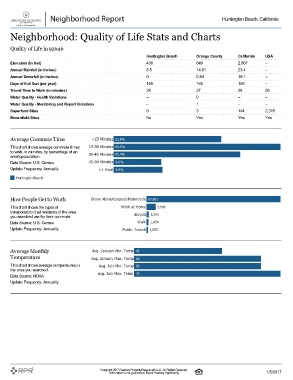
Neighborhood: Quality of Life Stats and Charts
Quality of Life in 92646
Huntington Beach Orange County California USA
Elevation (in feet) 436 649 2,807 –
Annual Rainfall (in inches) 8.5 14.81 23.4 –
Annual Snowfall (in inches) 0 0.84 19.1 –
Days of Full Sun (per year) 165 165 159 –
Travel Time to Work (in minutes) 28 27 28 26
Water Quality - Health Violations – 0 – –
Water Quality - Monitoring and Report Violations – 1 – –
Superfund Sites 0 3 144 2,315
Brownfield Sites No Yes Yes Yes
Average Commute Time
This chart shows average commute times
to work, in minutes, by percentage of an
area's population.
Data Source: U.S. Census
Update Frequency: Annually
Huntington Beach
How People Get to Work
This chart shows the types of
transportation that residents of the area
you searched use for their commute.
Data Source: U.S. Census
Update Frequency: Annually
Average Monthly
Temperature
This chart shows average temperatures in
the area you searched.
Data Source: NOAA
Update Frequency: Annually
Copyright 2017 Realtors Property Resource® LLC. All Rights Reserved.
Information is not guaranteed. Equal Housing Opportunity. 1/5/2017