
Page 5 - Neighborhood Report
P. 5
Huntington Beach, California
Neighborhood: People Stats and Charts
Huntington Beach Orange County California USA
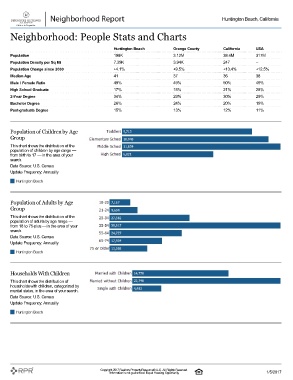
Population 198K 3.12M 38.4M 317M
Population Density per Sq Mi 7.39K 3.94K 247 –
Population Change since 2000 +4.1% +9.5% +13.4% +12.5%
Median Age 41 37 36 38
Male / Female Ratio 49% 49% 50% 49%
High School Graduate 17% 18% 21% 28%
2-Year Degree 34% 29% 30% 29%
Bachelor Degree 26% 24% 20% 19%
Post-graduate Degree 15% 13% 12% 11%
Population of Children by Age
Group
This chart shows the distribution of the
population of children by age range —
from birth to 17 — in the area of your
search.
Data Source: U.S. Census
Update Frequency: Annually
Huntington Beach
Population of Adults by Age
Group
This chart shows the distribution of the
population of adults by age range —
from 18 to 75-plus — in the area of your
search.
Data Source: U.S. Census
Update Frequency: Annually
Huntington Beach
Households With Children
This chart shows the distribution of
households with children, categorized by
marital status, in the area of your search.
Data Source: U.S. Census
Update Frequency: Annually
Huntington Beach
Copyright 2017 Realtors Property Resource® LLC. All Rights Reserved.
Information is not guaranteed. Equal Housing Opportunity. 1/5/2017