Page 9 - CSEB Report
P. 9

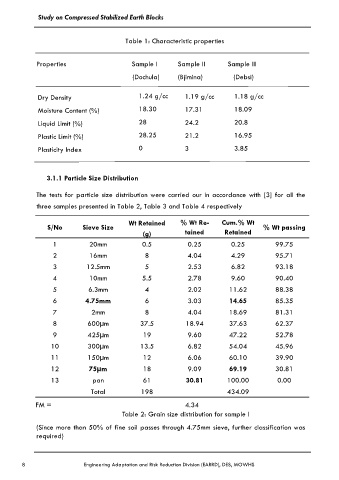
Study on Compressed Stabilized Earth Blocks


                                             Table 1: Characteristic properties


              Properties                                Sample I          Sample II           Sample III

                                                             (Dochula)         (Bjimina)               (Debsi)


              Dry Density                         1.24 g/cc       1.19 g/cc        1.18 g/cc

              Moisture Content (%)                18.30           17.31            18.09

                                                  28
              Liquid Limit (%)                                      24.2           20.8
              Plastic Limit (%)                   28.25           21.2             16.95

              Plasticity Index                    0               3                3.85


                 3.1.1 Particle Size Distribution


              The tests for particle size distribution were carried our in accordance with [3] for all the
              three samples presented in Table 2, Table 3 and Table 4 respectively


                                              Wt Retained       % Wt Re-       Cum.% Wt
                  S/No        Sieve Size                                                     % Wt passing
                                                   (g)            tained        Retained

                    1           20mm               0.5             0.25           0.25            99.75
                    2           16mm                8              4.04           4.29            95.71

                    3          12.5mm               5              2.53           6.82            93.18
                    4           10mm               5.5             2.78           9.60            90.40

                    5           6.3mm               4              2.02          11.62            88.38
                    6          4.75mm               6              3.03           14.65           85.35

                    7            2mm                8              4.04          18.69            81.31
                    8           600µm             37.5            18.94          37.63            62.37
                    9           425µm              19              9.60          47.22            52.78

                   10           300µm             13.5             6.82          54.04            45.96

                   11           150µm              12              6.06          60.10            39.90
                   12           75µm               18              9.09           69.19           30.81
                   13            pan               61             30.81          100.00           0.00

                                 Total            198                            434.09

              FM =                                                4.34
                                                        Table 2: Grain size distribution for sample I

              (Since more than 50% of fine soil passes through 4.75mm sieve, further classification was
              required)


         8                     Engineering Adaptation and Risk Reduction Division (EARRD), DES, MOWHS
   4   5   6   7   8   9   10   11   12   13   14