
Page 797 - AnnualEducationReport2018-19
P. 797
04/10/2019 Reason for Accountabili Overall EL General School Identificatio ty Status Index Value Participation Participation Quality/Stu n Index Value Index Value dent Success Index Value N/A N/A 80.09 100.00 100.00 83.76 N/A N/A 78.56 100.00 100.00 85.94 N/A N/A 94.72 100.00 100.00 91.69 N/A N/A 69.77 N/A 100.00 92.75 N/A N/A 68.64 N/A 100.00 88.45 N/A N/A 67.48 100.00 100.00 81.51 N/A N/A 75.96 N/A 100.00 83.66 N/A N/A N/A N/A N/A N/A Page 402 of 613
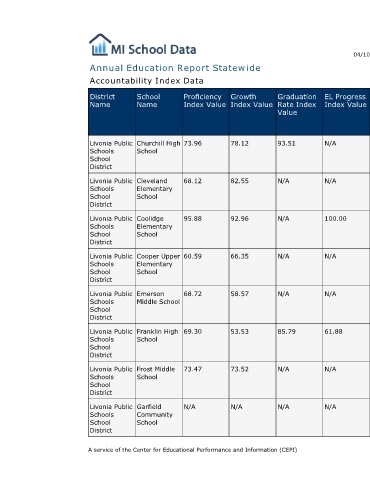
EL Progress Index Value N/A N/A 100.00 N/A N/A 61.88 N/A N/A
Graduation Rate Index Value 93.51 N/A N/A N/A N/A 85.79 N/A N/A
Annual Education Report Statewide
Growth Index Value 78.12 82.55 92.96 66.35 58.57 53.53 73.52 N/A
Proficiency Index Value 73.96 68.12 95.88 60.59 68.72 69.30 73.47 N/A A service of the Center for Educational Performance and Information (CEPI)
Accountability Index Data
School Name Churchill High School Cleveland Elementary School Coolidge Elementary School Cooper Upper Elementary School Emerson Middle School Franklin High School Frost Middle School Garfield Community School
District Name Livonia Public Schools School District Livonia Public Schools School District Livonia Public Schools School District Livonia Public Schools School District Livonia Public Schools School District Livonia Public Schools School District Livonia Public Schools School District Livonia Public Schools School District