
Page 799 - AnnualEducationReport2018-19
P. 799
04/10/2019 Reason for Accountabili Overall EL General School Identificatio ty Status Index Value Participation Participation Quality/Stu n Index Value Index Value dent Success Index Value N/A N/A 91.34 N/A 100.00 92.53 N/A N/A 80.96 N/A 100.00 90.94 N/A N/A 82.23 N/A 100.00 87.55 N/A N/A 99.28 100.00 100.00 95.37 N/A N/A N/A N/A N/A N/A N/A N/A 73.06 N/A 100.00 84.82 N/A N/A 94.17 N/A 100.00 87.55 N/A N/A 87.66 N/A N/A 87.66 Page 403 of 613
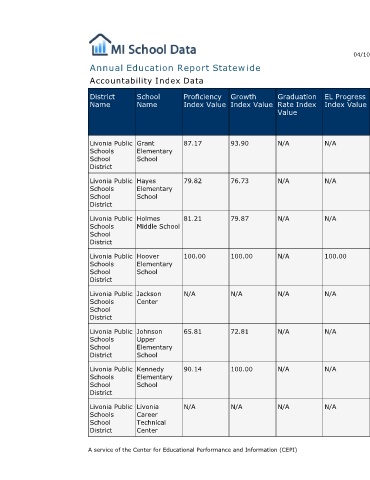
EL Progress Index Value N/A N/A N/A 100.00 N/A N/A N/A N/A
Graduation Rate Index Value N/A N/A N/A N/A N/A N/A N/A N/A
Annual Education Report Statewide
Growth Index Value 93.90 76.73 79.87 100.00 N/A 72.81 100.00 N/A
Proficiency Index Value 87.17 79.82 81.21 100.00 N/A 65.81 90.14 N/A A service of the Center for Educational Performance and Information (CEPI)
Accountability Index Data
School Name Grant Elementary School Hayes Elementary School Holmes Middle School Hoover Elementary School Jackson Center Johnson Upper Elementary School Kennedy Elementary School Livonia Career Technical Center
District Name Livonia Public Schools School District Livonia Public Schools School District Livonia Public Schools School District Livonia Public Schools School District Livonia Public Schools School District Livonia Public Schools School District Livonia Public Schools School District Livonia Public Schools School District