
Page 801 - AnnualEducationReport2018-19
P. 801
04/10/2019 Reason for Accountabili Overall EL General School Identificatio ty Status Index Value Participation Participation Quality/Stu n Index Value Index Value dent Success Index Value N/A N/A N/A N/A N/A N/A N/A N/A 88.28 N/A 100.00 62.36 N/A N/A 92.20 100.00 99.65 91.02 N/A N/A 78.73 N/A 100.00 88.03 N/A N/A 83.38 N/A 100.00 94.88 N/A N/A 95.03 N/A 100.00 97.93 N/A N/A 91.63 100.00 100.00 92.56 Page 404 of 613
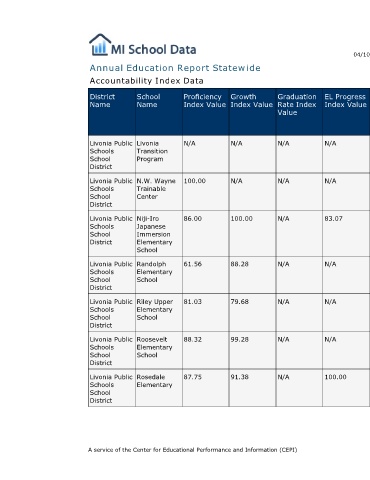
EL Progress Index Value N/A N/A 83.07 N/A N/A N/A 100.00
Graduation Rate Index Value N/A N/A N/A N/A N/A N/A N/A
Annual Education Report Statewide
Growth Index Value N/A N/A 100.00 88.28 79.68 99.28 91.38
Proficiency Index Value N/A 100.00 86.00 61.56 81.03 88.32 87.75 A service of the Center for Educational Performance and Information (CEPI)
Accountability Index Data
School Name Livonia Transition Program N.W. Wayne Trainable Center Niji-Iro Japanese Immersion Elementary School Randolph Elementary School Riley Upper Elementary School Roosevelt Elementary School Rosedale Elementary
District Name Livonia Public Schools School District Livonia Public Schools School District Livonia Public Schools School District Livonia Public Schools School District Livonia Public Schools School District Livonia Public Schools School District Livonia Public Schools School District