
Page 220 - AnnualEducationReport2018-19
P. 220
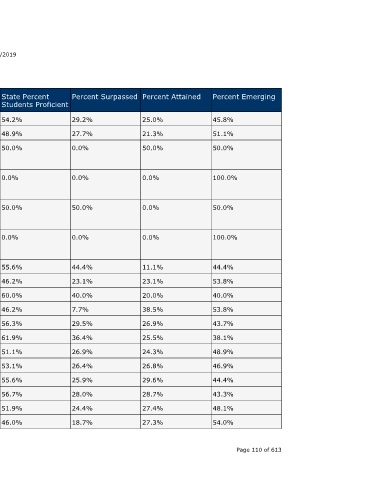
Percent Emerging  45.8%  51.1%  50.0%  100.0%  50.0%  100.0%  44.4%  53.8%  40.0%  53.8%  43.7%  38.1%  48.9%  46.9%  44.4%  43.3%  48.1%  54.0%  Page 110 of 613


                                  Percent Attained  25.0%  21.3%  50.0%  0.0%  0.0%  0.0%  11.1%  23.1%  20.0%  38.5%  26.9%  25.5%  24.3%  26.8%  29.6%  28.7%  27.4%  27.3%


                                  Percent Surpassed  29.2%  27.7%  0.0%  0.0%  50.0%  0.0%  44.4%  23.1%  40.0%  7.7%  29.5%  36.4%  26.9%  26.4%  25.9%  28.0%  24.4%  18.7%


                                  State Percent Students Proficient


                    04/10/2019           54.2%  48.9%  50.0%  0.0%    50.0%     0.0%      55.6%  46.2%  60.0%  46.2%  56.3%  61.9%  51.1%  53.1%  55.6%  56.7%  51.9%  46.0%


                                  School Year  2016-17  2017-18  2016-17  2017-18  2016-17  2017-18  2016-17  2017-18  2016-17  2017-18  2016-17  2017-18  2016-17  2017-18  2016-17  2017-18  2016-17  2017-18


                                  Testing Group  Hispanic of Any Race  Hispanic of Any Race  Native Hawaiian or  Other Pacific  Islander  Native Hawaiian or  Other Pacific  Islander  Native Hawaiian or  Other Pacific  Islander  Native Hawaiian or  Other Pacific  Islander  Two or More Races  Two or More Races  Two or More Races  Two or More Races  White  White  White  White  Female  Female  Female  Female


                        Annual Education Report Statewide


                             MI-Access Participation  Grade  Subject  3rd Grade Content Mathematics  3rd Grade Content Mathematics  3rd Grade Content  ELA  3rd Grade Content  ELA  3rd Grade Content Mathematics  3rd Grade Content Mathematics  3rd Grade Content  ELA  3rd Grade Content  ELA  3rd Grade Content Mathematics  3rd Grade Content Mathematics  3rd Grade Content  ELA  3rd Grade Content  ELA  3rd Grade Content Mathematics  3rd Grade Content Mathematics  3rd Grade Content  ELA  3rd Grade Content  ELA  3rd Grade Content Mathematics  3rd Grade Content Mathematics A service of the Center for Educational Performance and Infor