
Page 360 - AnnualEducationReport2018-19
P. 360
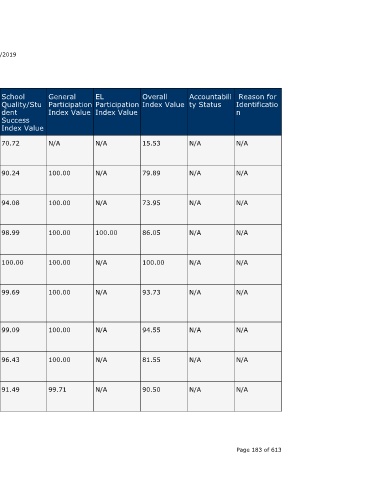
Reason for  Identificatio  n  N/A  N/A  N/A  N/A     N/A       N/A          N/A      N/A       N/A                 Page 183 of 613


                                  Accountabili  ty Status  N/A  N/A  N/A       N/A      N/A       N/A          N/A      N/A       N/A


                                  Overall  Index Value  15.53  79.89  73.95    86.05    100.00    93.73        94.55    81.55     90.50


                                    Participation  Index Value


                                  EL             N/A       N/A       N/A       100.00   N/A       N/A          N/A      N/A       N/A


                                  General  Participation  Index Value  N/A  100.00  100.00  100.00  100.00  100.00  100.00  100.00  99.71


                    04/10/2019    School  Quality/Stu  dent  Success  Index Value  70.72  90.24  94.08  98.99  100.00  99.69  99.09  96.43  91.49


                                  EL Progress  Index Value  N/A  N/A  N/A      100.00   N/A       N/A          N/A      N/A       N/A


                                  Graduation  Rate Index  Value  36.13  N/A  N/A  N/A   N/A       N/A          N/A      N/A       90.22


                        Annual Education Report Statewide
                                  Growth  Index Value  0.00  80.02   62.06     80.05    100.00    92.32        92.01    76.25     100.00


                                  Proficiency  Index Value  0.00  73.36  76.38  80.59   100.00    92.08        94.96    79.31     78.35               A service of the Center for Educational Performance and Information (CEPI)


                             Accountability Index Data


                                  School  Name   Birch Run  Progressive  High School  Marshall  Greene  Middle School  North  Elementary  School  Berkshire  Middle School  Beverly  Elementary  School  Bingham  Farms  Elementary  School  Birmingham  Covington  School  Derby Middle  School  Ernest W.  Seaholm High  School


                                  District  Name  Birch Run  Area Schools  Birch Run  Area Schools  Birch Run  Area Schools  Birmingham  Public  Schools  Birmingham  Public  Schools  Birmingham  Public  Schools  Birmingham  Public  Schools  Birmingham  Public  Schools  Birmingham  Public  Schools