
Page 361 - AnnualEducationReport2018-19
P. 361
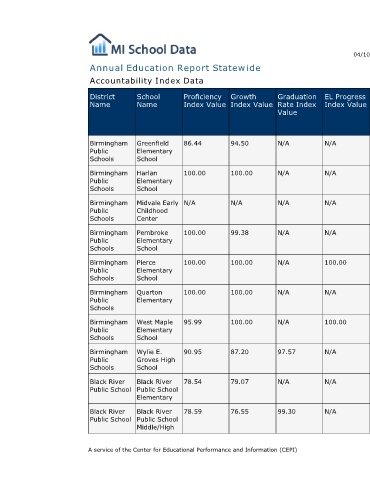
04/10/2019     Reason for Accountabili  Overall  EL General  School  Identificatio ty Status Index Value Participation Participation Quality/Stu  n Index Value Index Value  dent  Success  Index Value  N/A  N/A  91.99  N/A  100.00  96.28  N/A  N/A  100.00  N/A  100.00  100.00  N/A  N/A  N/A  N/A  N/A  N/A  N/A  N/A  99.46  N/A  100.00  98.46  N/A  N/A  99.95  100.00  100.00  99.69  N/A  N/A  100.00  N/A  100.00  100.00  N/A  N/A  98.71  100.00  100.00  100.00  N/A  N/A  91.02  100.00  100.00  93.91  N/A  N/A  82.50  N/A 100.00  96.54  N/A  N/A  83.37  N/A  100.00  96.14  Page 184 of 613
                                  EL Progress  Index Value  N/A  N/A  N/A      N/A      100.00    N/A       100.00    N/A       N/A       N/A


                                  Graduation  Rate Index  Value  N/A  N/A  N/A  N/A     N/A       N/A       N/A       97.57     N/A       99.30


                        Annual Education Report Statewide
                                  Growth  Index Value  94.50  100.00  N/A      99.38    100.00    100.00    100.00    87.20     79.07     76.55


                                  Proficiency  Index Value  86.44  100.00  N/A  100.00  100.00    100.00    95.99     90.95     78.54     78.59       A service of the Center for Educational Performance and Information (CEPI)

                             Accountability Index Data


                                  School  Name   Greenfield  Elementary  School  Harlan  Elementary  School  Midvale Early  Childhood  Center  Pembroke  Elementary  School  Pierce  Elementary  School  Quarton  Elementary  West Maple  Elementary  School  Wylie E.  Groves High  School  Black River  Public School  Elementary  Black River  Public School  Middle/High


                                  District  Name  Birmingham  Public  Schools  Birmingham  Public  Schools  Birmingham  Public  Schools  Birmingham  Public  Schools  Birmingham  Public  Schools  Birmingham  Public  Schools  Birmingham  Public  Schools  Birmingham  Public  Schools  Black River  Public School  Black River  Public School