
Page 366 - AnnualEducationReport2018-19
P. 366
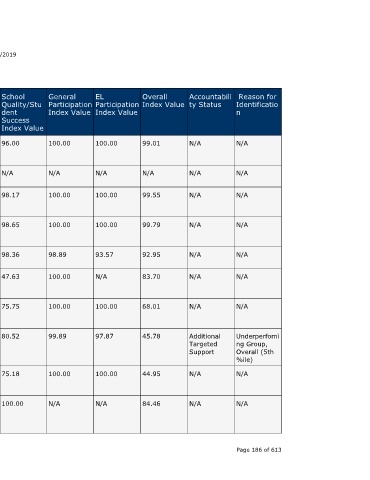
Reason for  Identificatio  n  N/A  N/A  N/A  N/A   N/A    N/A       N/A       Underperfomi  ng Group,  Overall (5th  %ile)  N/A  N/A  Page 186 of 613


                                  Accountabili  ty Status  N/A  N/A  N/A    N/A       N/A    N/A       N/A       Additional  Targeted  Support  N/A  N/A


                                  Overall  Index Value  99.01  N/A  99.55   99.79     92.95  83.70     68.01     45.78       44.95     84.46


                                    Participation  Index Value


                                  EL             100.00    N/A    100.00    100.00    93.57  N/A       100.00    97.87       100.00    N/A


                                  General  Participation  Index Value  100.00  N/A  100.00  100.00  98.89  100.00  100.00  99.89  100.00  N/A


                    04/10/2019    School  Quality/Stu  dent  Success  Index Value  96.00  N/A  98.17  98.65  98.36  47.63  75.75  80.52  75.18  100.00


                                  EL Progress  Index Value  100.00  N/A  100.00  100.00  100.00  N/A   94.92     27.00       60.01     N/A


                                  Graduation  Rate Index  Value  N/A  N/A  N/A  N/A   N/A    N/A       N/A       81.25       N/A       70.75


                        Annual Education Report Statewide
                                  Growth  Index Value  N/A  N/A   N/A       100.00    90.55  N/A       55.78     32.29       32.17     92.27


                                  Proficiency  Index Value  100.00  N/A  100.00  100.00  90.31  100.00  66.03    33.51       34.44     72.54          A service of the Center for Educational Performance and Information (CEPI)


                             Accountability Index Data


                                  School  Name   Eastover  Elementary  School  Fox Hills  Center  Lone Pine  Elementary  School  Way  Elementary  School  West Hills  Middle School  Wing Lake  Development  al Center  Bloomingdale  Elementary  School  Bloomingdale  Middle and  High School  Pullman  Elementary  School  Blue Water  Middle  College  Academy


                                  District  Name  Bloomfield  Hills Schools  Bloomfield  Hills Schools  Bloomfield  Hills Schools  Bloomfield  Hills Schools  Bloomfield  Hills Schools  Bloomfield  Hills Schools  Bloomingdale  Public School  District  Bloomingdale  Public School  District  Bloomingdale  Public School  District  Blue Water  Middle  College